Led by larger urban metro markets, single-family growth rates are showing signs of a turnaround as moderating mortgage rates and a lack of existing inventory are contributing to a gradual upward trend, according to the latest findings from the National Association of Home Builders (NAHB) Home Building Geography Index (HBGI) for the fourth quarter of 2023.
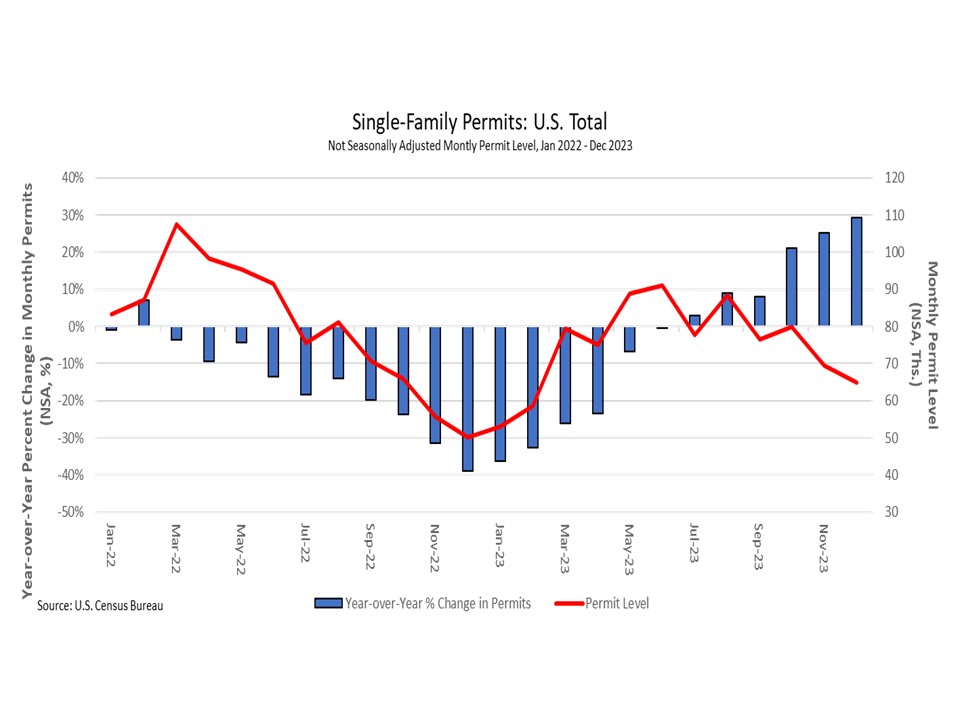
The lowest single-family year-over-year growth rate in the fourth quarter of 2023 occurred in micro counties, which posted an 11.7% decline. Most markets, apart from small metro outlying counties (0.4%), continued to post declines. Despite these declines, the rates for large/small metro areas showed remarkable improvements as they rose from double-digit declines to just above 5% declines across the board. Nationally, from the Census Bureau’s monthly new residential construction survey, single-family permits for the three final months of the year (fourth quarter) were over 20% higher than the previous year’s level. The HBGI growth rates, which are based on a moving average of permit rates, began to rise as permit levels in the fourth quarter of 2023 increase by 24.8% nationally compared to the fourth quarter of 2022.

Meanwhile, micro counties lost 0.4 percentage points of market share over the quarter as they lost out to larger markets. Large metro suburban counties gained 0.3 percentage points, small metro core counties gained 0.2 percentage points, and large metro core counties gained 0.1 percentage point. Large metro outlying counties and small metro outlying counties remained unchanged over the quarter while non micro/metro counties lost 0.2 percentage points of market share.
In the multifamily sector, growth rates were negative or unchanged in the nation’s largest metro and suburban counties, while growth rates exhibited the strongest readings in lower-density areas. Non-metro/micro counties had a growth rate of 10.0%. Despite having the smallest share of multifamily construction, this market has posted 12 consecutive quarters of growth according to the multifamily HBGI. All other HBGI markets experienced declines, with the largest occurring in large metro suburban counties (down 20.0%). Between the fourth quarter of 2022 and 2023, large metro suburban counties fell 40 percentage points as multifamily construction slowed from the high levels of 2022.
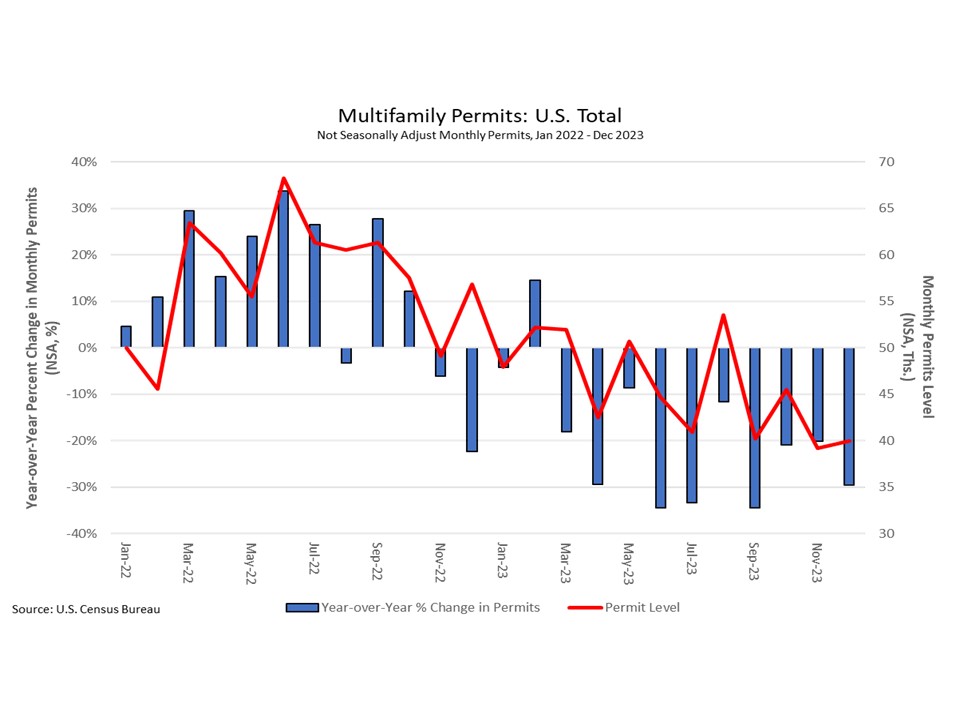
As expected, the HBGI multifamily declines are in line with national permit trends. The final three months of 2023 were all over 20.0% lower in multifamily permits compared to the 2022 levels. For the fourth quarter, permits were 23.7% lower in 2023 than 2022 according to Census estimates.

The biggest multifamily market by share, large metro core counties, gained 0.1 percentage point in market share in the fourth quarter after it had declined for most of the year. The largest gain in market share over the quarter was in small metro core counties as the market share increased 0.4 percentage points to 23.7%. Large metro suburban counties lost 0.6 percentage points as they experienced the largest decline in construction, down to 26.3% (2023 Q4).
The fourth quarter of 2023 HBGI data can be found at http://nahb.org/hbgi.
Discover more from Eye On Housing
Subscribe to get the latest posts sent to your email.

This article highlights the promising signs of increased single-family production nationwide, signaling potential growth in the housing sector. For construction loans, this uptick in activity presents opportunities for lenders to provide financing solutions to support the surge in single-family home construction projects. By offering flexible loan options, lenders can assist builders and developers in capitalizing on the growing demand for new homes, contributing to the expansion of the housing market.