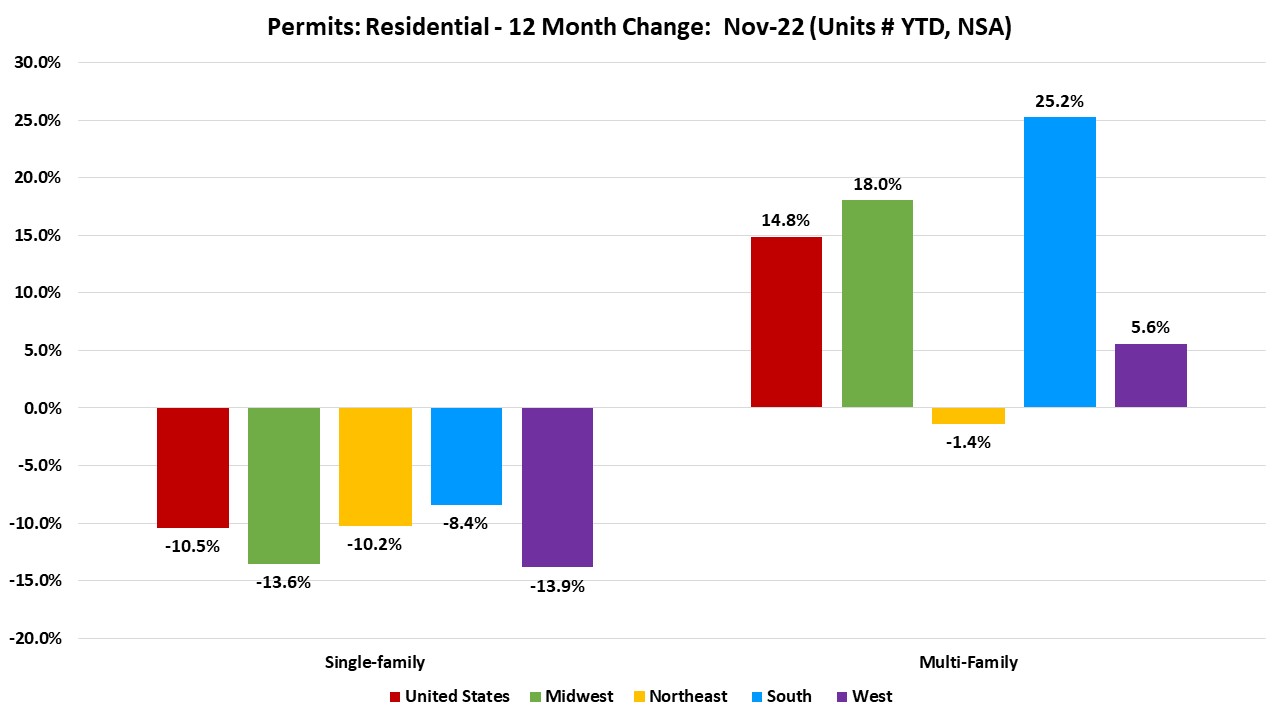
Over the first eleven months of 2022, the total number of single-family permits issued year-to-date (YTD) nationwide reached 921,626. On a year-over-year (YoY) basis, this is 10.5% below the November 2021 level of 1,029,208.

Year-to-date ending in November, single-family permits declined in all four regions. The South posted a decline of 8.4%, while the West region reported the steepest decline of 13.9%. The Northeast declined by 10.2% and the Midwest declined by 13.6% in single-family permits during this time. On the other hand, multifamily permits posted increased in all but one region, Northeast (-1.4%). Permits were 25.2% higher in the South, 18.0% higher in the Midwest, and 5.6% higher in the West.
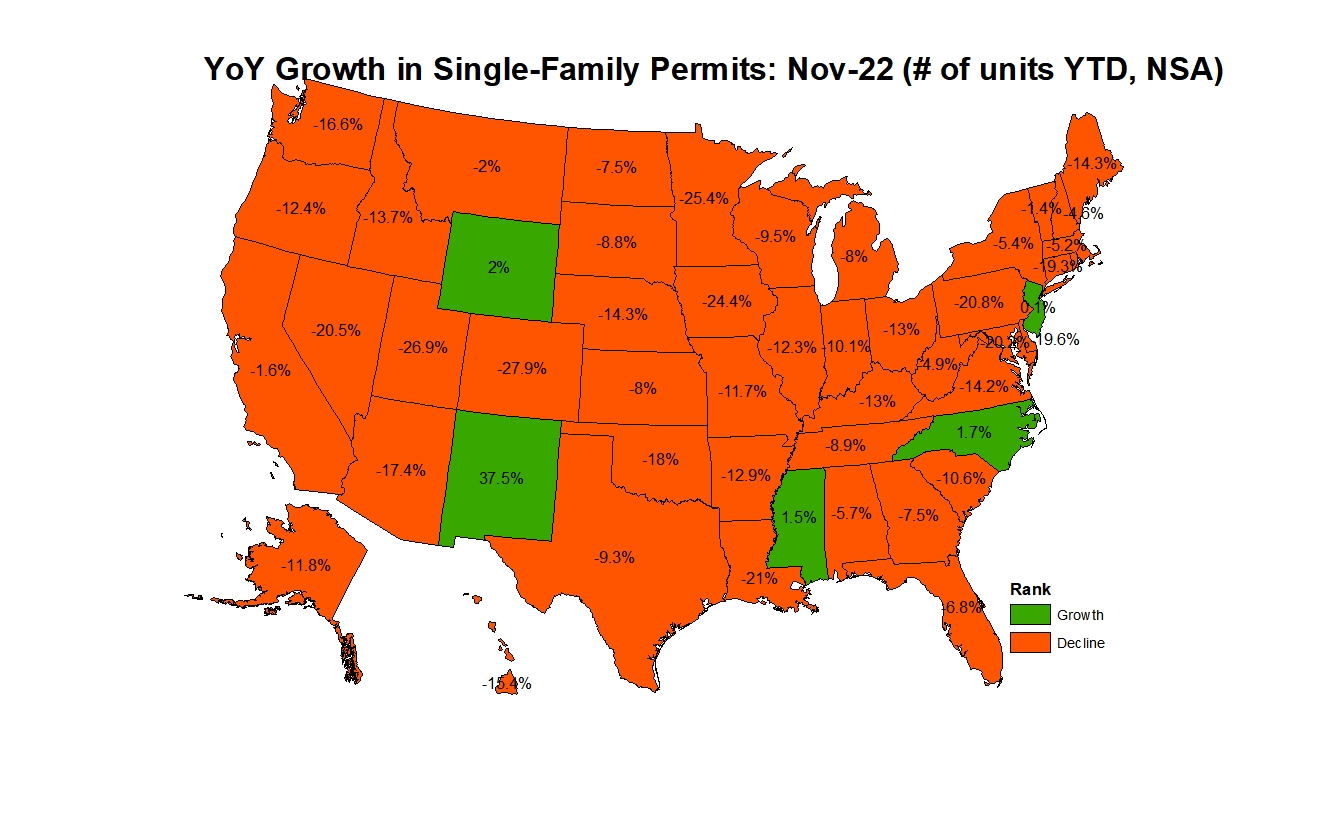
Between November 2021 YTD and November 2022 YTD, five states and the District of Columbia saw growth in single-family permits issued. New Mexico recorded the highest growth rate during this time at 37.5% going from 5,083 permits to 6,989. Forty-five states reported a decline in single-family permits during this time with Colorado posting the steepest decline of 27.9% declining from 31,741 permits to 22,900. The ten states issuing the highest number of single-family permits combined accounted for 63.4% of the total single-family permits issued.

Year-to-date, ending in November, the total number of multifamily permits issued nationwide reached 624,128. This is 14.8% ahead of the November 2021 level of 543,508.
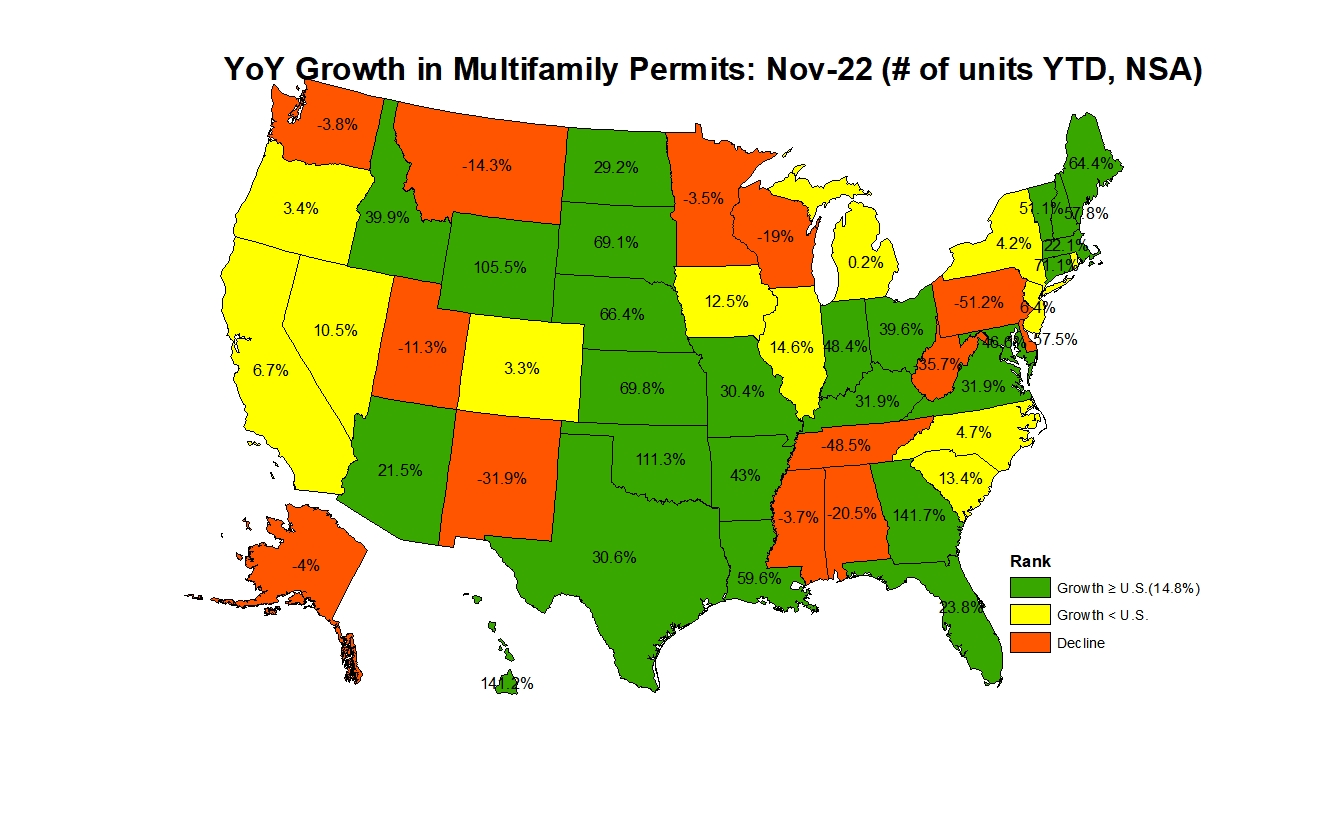
Between November 2021 YTD and November 2022 YTD, 37 states and the District of Columbia recorded growth, while 13 states recorded a decline in multifamily permits. Georgia led the way with a sharp rise (141.7%) in multifamily permits from 11,385 to 27,520 while Delaware had the largest decline of 57.5% from 1,235 to 525. The ten states issuing the highest number of multifamily permits combined accounted for 63.3% of the multifamily permits issued.

At the local level, below are the top ten metro areas that issued the highest number of single-family permits.
| Metropolitan Statistical Area | Single-Family Permits: Nov-22 (Units #YTD, NSA) |
| Houston-The Woodlands-Sugar Land, TX | 45,584 |
| Dallas-Fort Worth-Arlington, TX | 41,275 |
| Phoenix-Mesa-Scottsdale, AZ | 25,831 |
| Atlanta-Sandy Springs-Roswell, GA | 25,278 |
| Austin-Round Rock, TX | 20,589 |
| Charlotte-Concord-Gastonia, NC-SC | 17,900 |
| Orlando-Kissimmee-Sanford, FL | 15,110 |
| Tampa-St. Petersburg-Clearwater, FL | 14,785 |
| Nashville-Davidson–Murfreesboro–Franklin, TN | 14,523 |
| Jacksonville, FL | 13,345 |
For multifamily permits, below are the top ten local areas that issued the highest number of permits.
| Metropolitan Statistical Area | Multifamily Permits: Nov-22 (Units #YTD, NSA) |
| New York-Newark-Jersey City, NY-NJ-PA | 43,165 |
| Dallas-Fort Worth-Arlington, TX | 30,980 |
| Houston-The Woodlands-Sugar Land, TX | 26,012 |
| Austin-Round Rock, TX | 21,855 |
| Los Angeles-Long Beach-Anaheim, CA | 19,959 |
| Atlanta-Sandy Springs-Roswell, GA | 18,964 |
| Washington-Arlington-Alexandria, DC-VA-MD-WV | 18,410 |
| Seattle-Tacoma-Bellevue, WA | 18,405 |
| Phoenix-Mesa-Scottsdale, AZ | 17,149 |
| Minneapolis-St. Paul-Bloomington, MN-WI | 14,802 |
Discover more from Eye On Housing
Subscribe to get the latest posts sent to your email.

Georgia’s growth in permits of 141% is astonishing. The Atlanta region does look poised for big growth this year. Will these stats change the business plans of property management companies and will rents drop with the new infusion in 2023?
There are currently 943,000 apartments under construction across the county. Once these are completed, it’s should add much needed supply and hopefully that will help bring the rents down to more manageable levels.
Thanks Danushka, that’s a good number given the situation. The huge flow of immigrants across the border is one variable that might require 2,000,000+ units/year needed. Not sure that rents will fall though. Demand seems very strong.