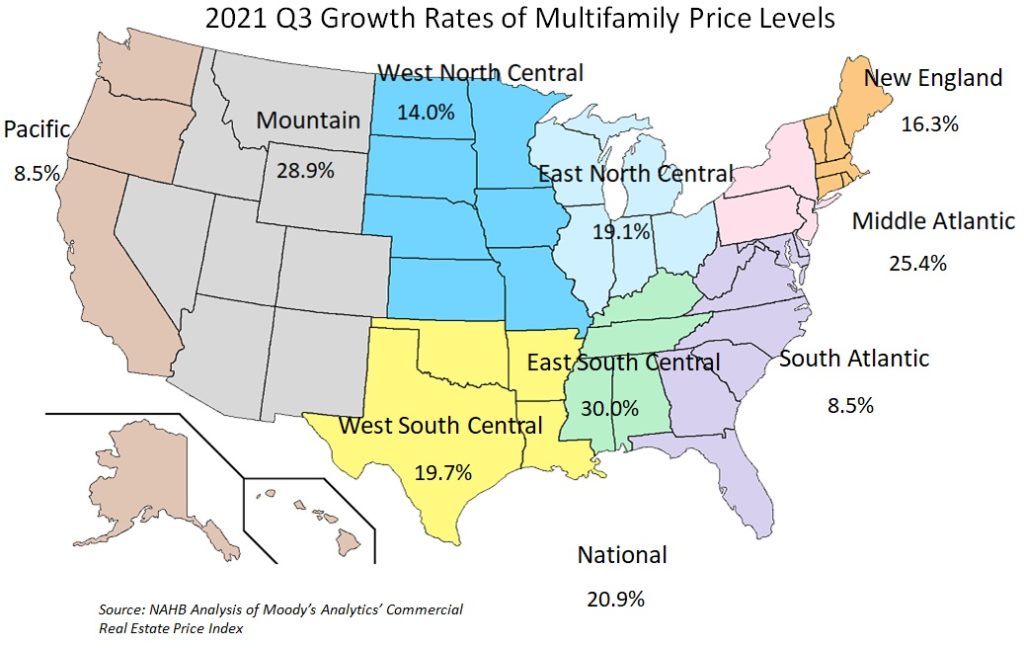
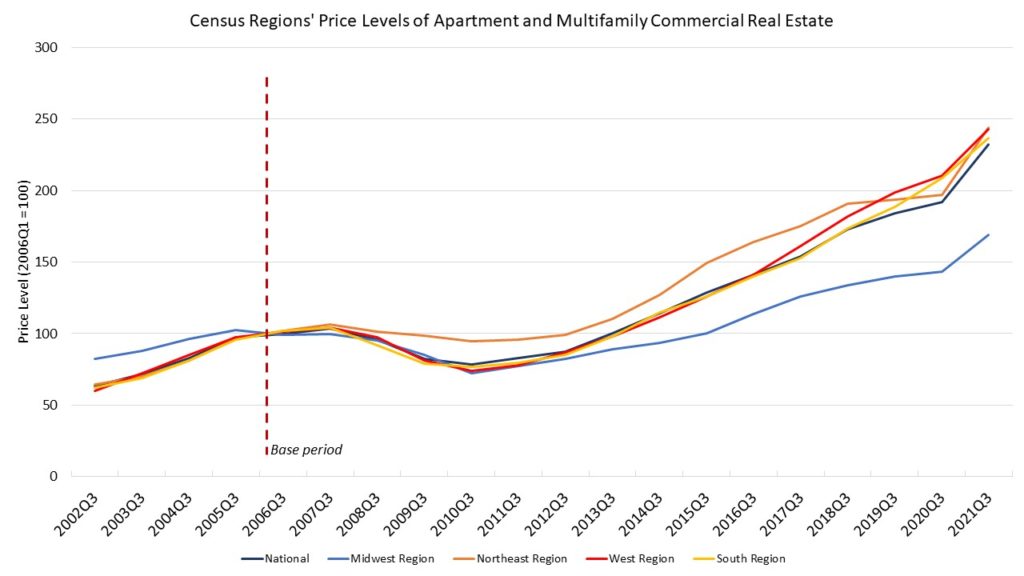
In the third quarter of 2021, the demand for apartment and other multifamily properties surged, contributing to the rise in their price levels, as shown by the Commercial Real Estate Price Index (CREPI) series. This recent development owed to a combination of several related factors: an increase in COVID-19 vaccinations, more lenient lending standards by banks, unprecedented home price growth, and increased demand for commercial real estate.
The CREPI measures the price levels of the U.S. commercial real estate market and its components in the nation as whole and certain subnational levels. In this post, we focus on the CREPI quarterly series of the apartment and multifamily sector by Census Regional and Divisional levels. The apartment and multifamily sector is the only residential sector of commercial real estate.
The Index uses a base period where the price level is set to 100 to benchmark all future and past periods’ price levels. For this series, the base period is the first quarter of 20061. The third quarter of 2021 is the latest quarter for which data are available at the national and the selected subnational levels.
The National Price level in Q3 2021 stood at 232, almost two-and-a-half times the price level in the base period. The Northeast, West, and South Regions’ price indexes hovered slightly above the national level. The above figure shows that all Regions’ price levels dipped following the Great Recession and accelerated thereafter. The Census Region that lagged the most behind its counterparts was the Midwest region, which increased the slowest following Q4 2008, with its Index value at 169.
Meanwhile, in the Census divisions, the CREPI apartment and multifamily index showed positive but varying year-over-year (YoY) growth rates. In the third quarter, the national price level increased by 25.9 percent from the previous year. Eight of the nine divisions showed larger YoY growth rates than a year ago. The South Atlantic Division performed about the same as last year, at 8 percent. The lowest YoY growth rate was in the Pacific division at 8.5 percent and the highest was in the East South Central Division at 30 percent.

The differing growth rates were in part a function of the then-prevalent delta variant, but overall multifamily properties were less adversely affected than in the previous year. Sales volume picked up and banks reported easier lending standards for CRE loans.
- Additionally, all future and past periods’ price levels in the Index account for properties strictly akin to those measured in the base period. The CREPI uses a repeat sales methodology that accounts for properties that have sold more than once in the time frame of all observations and meet additional criteria pertaining to the manner of the sale. It deserves noting that only corporate-owned sales are included in the data set.
Discover more from Eye On Housing
Subscribe to get the latest posts sent to your email.

