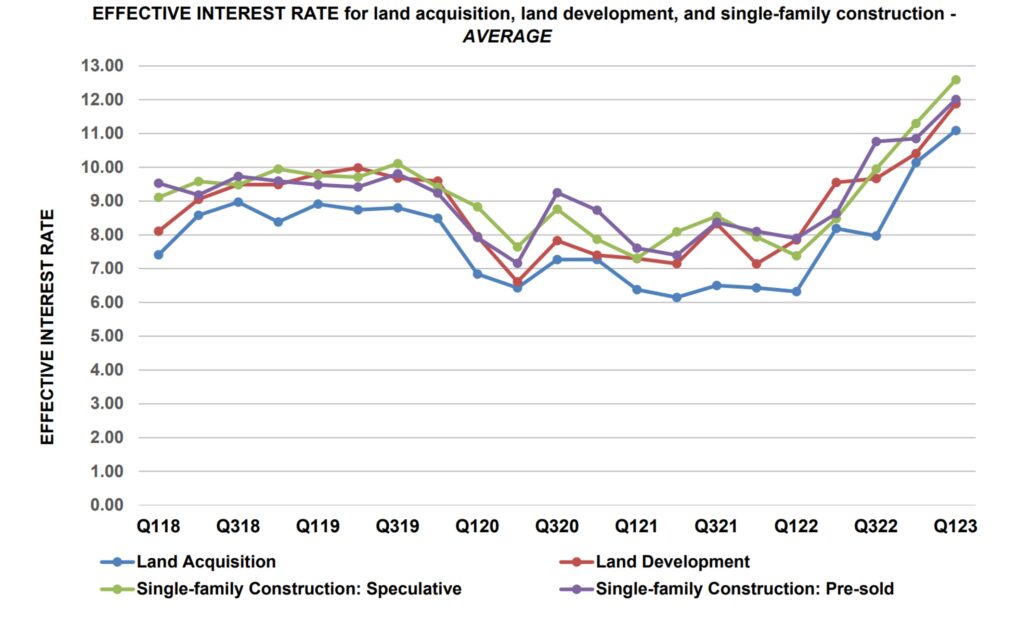
While mortgage rates were stabilizing in the first quarter of 2023, rates on loans for Acquisition, Development & Construction (AD&C) continued to climb, according to NAHB’s quarterly Survey on AD&C Financing. From the last quarter of 2022 to the first quarter of 2023, the average effective rate (based on rate of return to the lender over the assumed life of the loan taking both the contract interest rate and initial fee into account) increased on all four categories of loans tracked in the AD&C Survey: from 10.14 to 11.09 percent on loans for land acquisition, from 10.41 to 11.88 percent on loans for land development, from 11.30 to 12.59 percent on loans for speculative single-family construction, and from 10.85 to 12.01 percent on loans for pre-sold single-family construction. In all four cases, the effective rate was higher in 2023 Q1 than it had at been at any time since NAHB began collecting the data in 2018.

Increases in the effective rate may be due either to increases in the contract interest rate charged on outstanding balances or to increases in the initial points charged on the loans. The first-quarter increases in effective rates on AD&C loans were driven primarily by strong increases in the underlying contract interest rate. The average contract rate increased from 7.80 to 8.50 percent on loans for land acquisition, from 7.37 to 8.19 percent on loans for land development, from 7.46 to 8.10 percent on loans for speculative single-family construction, and from 6.97 to 7.61 percent on loans for pre-sold single-family construction.
Results were more mixed for initial points charged on the loans. During the first quarter, average initial points actually declined on two categories of AD&C loans: from 0.82 to 0.79 percent for speculative single-family construction, and from 0.59 to 0.53 percent on loans for pre-sold single-family construction. Meanwhile, average initial points increased from 0.81 to 0.85 percent on land development loans, and from 0.79 to 0.81 percent on land acquisition loans.
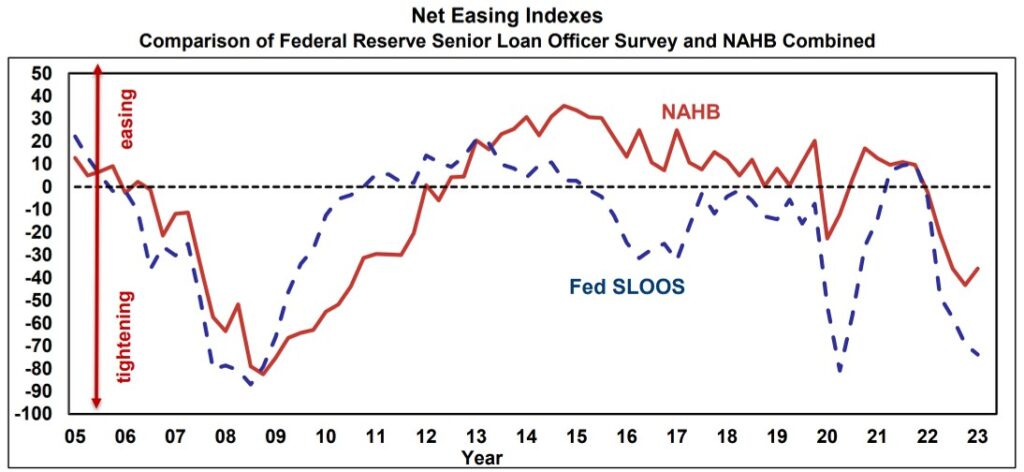
The NAHB AD&C financing survey also collects data on credit availability. To help readers interpret these data, NAHB generates a net easing index, similar to the net easing index based on the Federal Reserve’s survey of senior loan officers. In the first quarter of 2023, both the NAHB and Fed indices were negative, indicating tightening credit conditions. This was the fifth consecutive quarter during which the indices from both surveys were negative. In the last quarter of 2022, the NAHB net easing index stood at -43.3 before increasing to -36.0 in the first quarter of 2023. Meanwhile, the Fed net easing index was -69.2 in the fourth quarter of 2022, but subsequently dropped even lower, to -73.8.

The most common ways in which lenders tightened in the first quarter were by increasing the interest rate on the loans (cited by 80 percent of the builders and developers who reported tighter credit conditions), reducing amount they are willing to lend and lowering the allowable Loan-to-Value or Loan-to-Cost ratio (66 percent each).
More detail on current credit conditions for builders and developers is available on NAHB’s AD&C Financing Survey web page.
Discover more from Eye On Housing
Subscribe to get the latest posts sent to your email.

This article provides an important insight into how construction loan rates have been steadily increasing in recent years. Knowing this is key to understanding the financial implications of taking out a construction loan. Us at builderloans.net can help you out in your construction loan needs