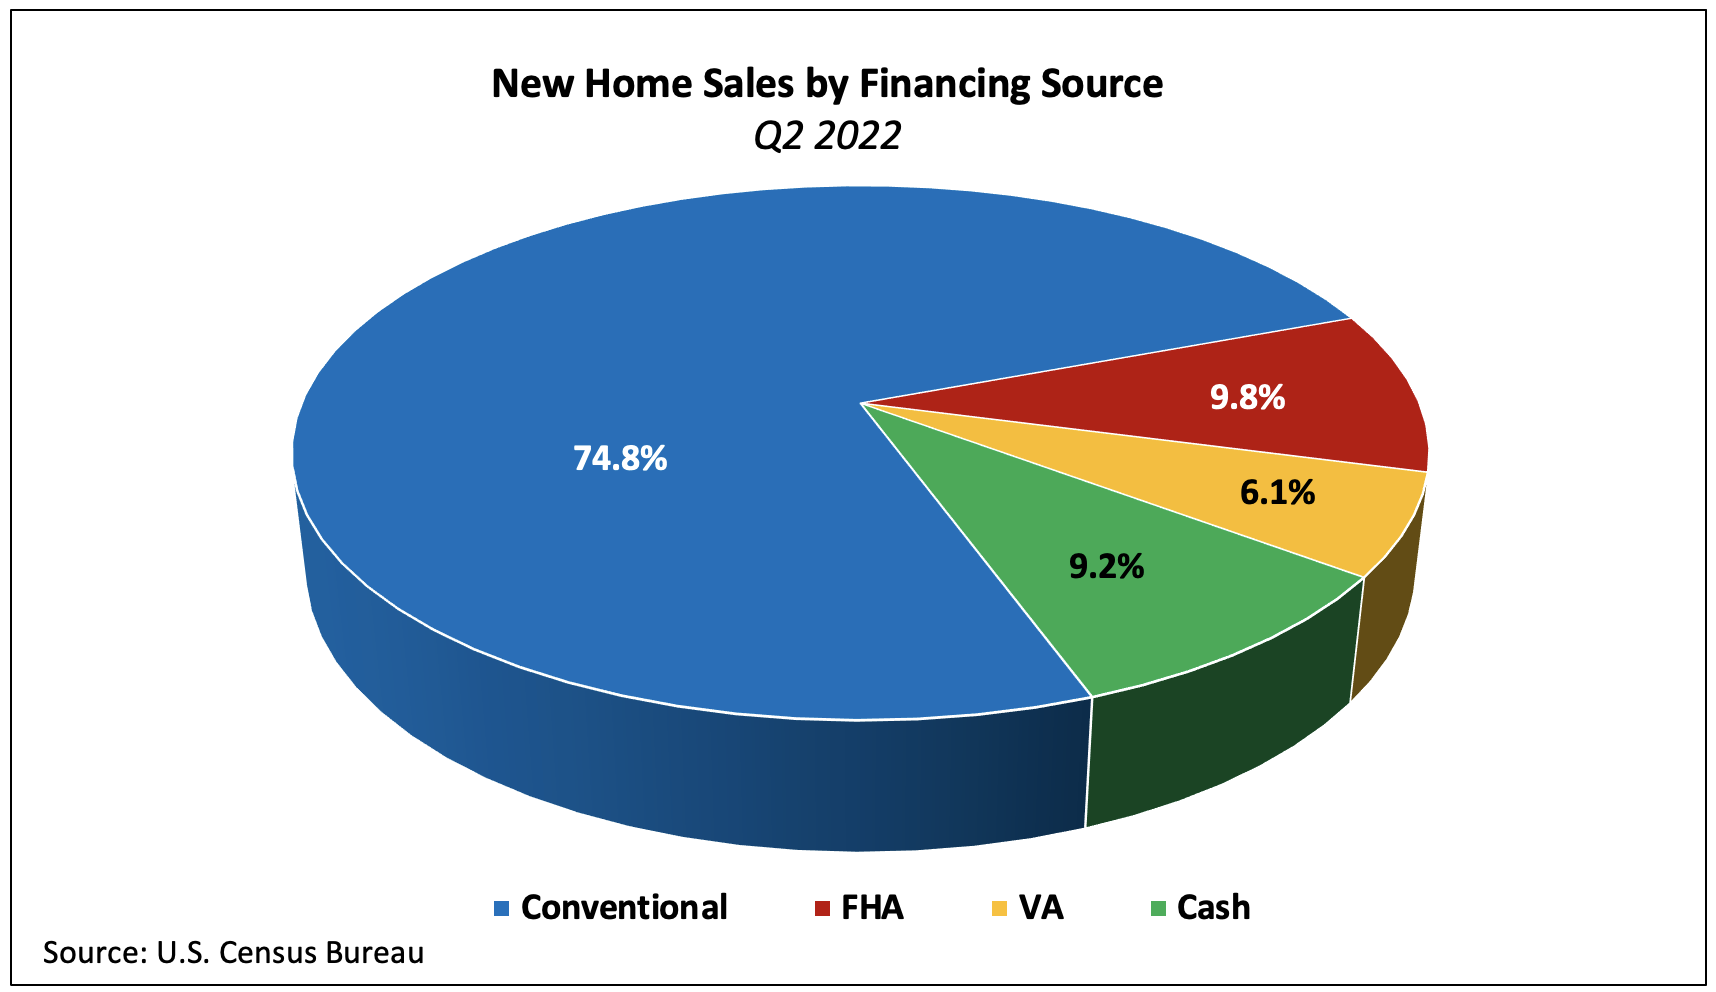
NAHB analysis of the most recent Quarterly Sales by Price and Financing published by the U.S. Census Bureau reveals that the four-quarter moving average (MA) share of new home sales financed through FHA was 11.0% in Q2 2022–its smallest share since early 2008. Conventional loans financed 74.8% of new home sales in the second quarter of 2022—a 1.8 percentage point quarter-over-quarter decline. Prior to the Q2 decline, the share had risen each of the past five quarters.

As conventional loan market share falls, the FHA share typically increases and vice versa. Over the past four quarters, the share of new home sales (four-quarter moving average) financed with conventional loans has climbed 4.3 ppts while FHA’s market share has decreased 6.2 ppts.
The share of VA-backed sales rose 0.8 percentage point to 6.1% in the second quarter–0.4 ppts lower than the share one year prior. Cash purchases made up a slightly higher share of sales in the fourth quarter—up 0.6 ppt—as they accounted for 9.2% of the total although the number of sales fell 3,000. The share of cash purchases has climbed four of the past five quarters since reaching its most recent trough of 4.4% and is the largest share since Q4 2014.
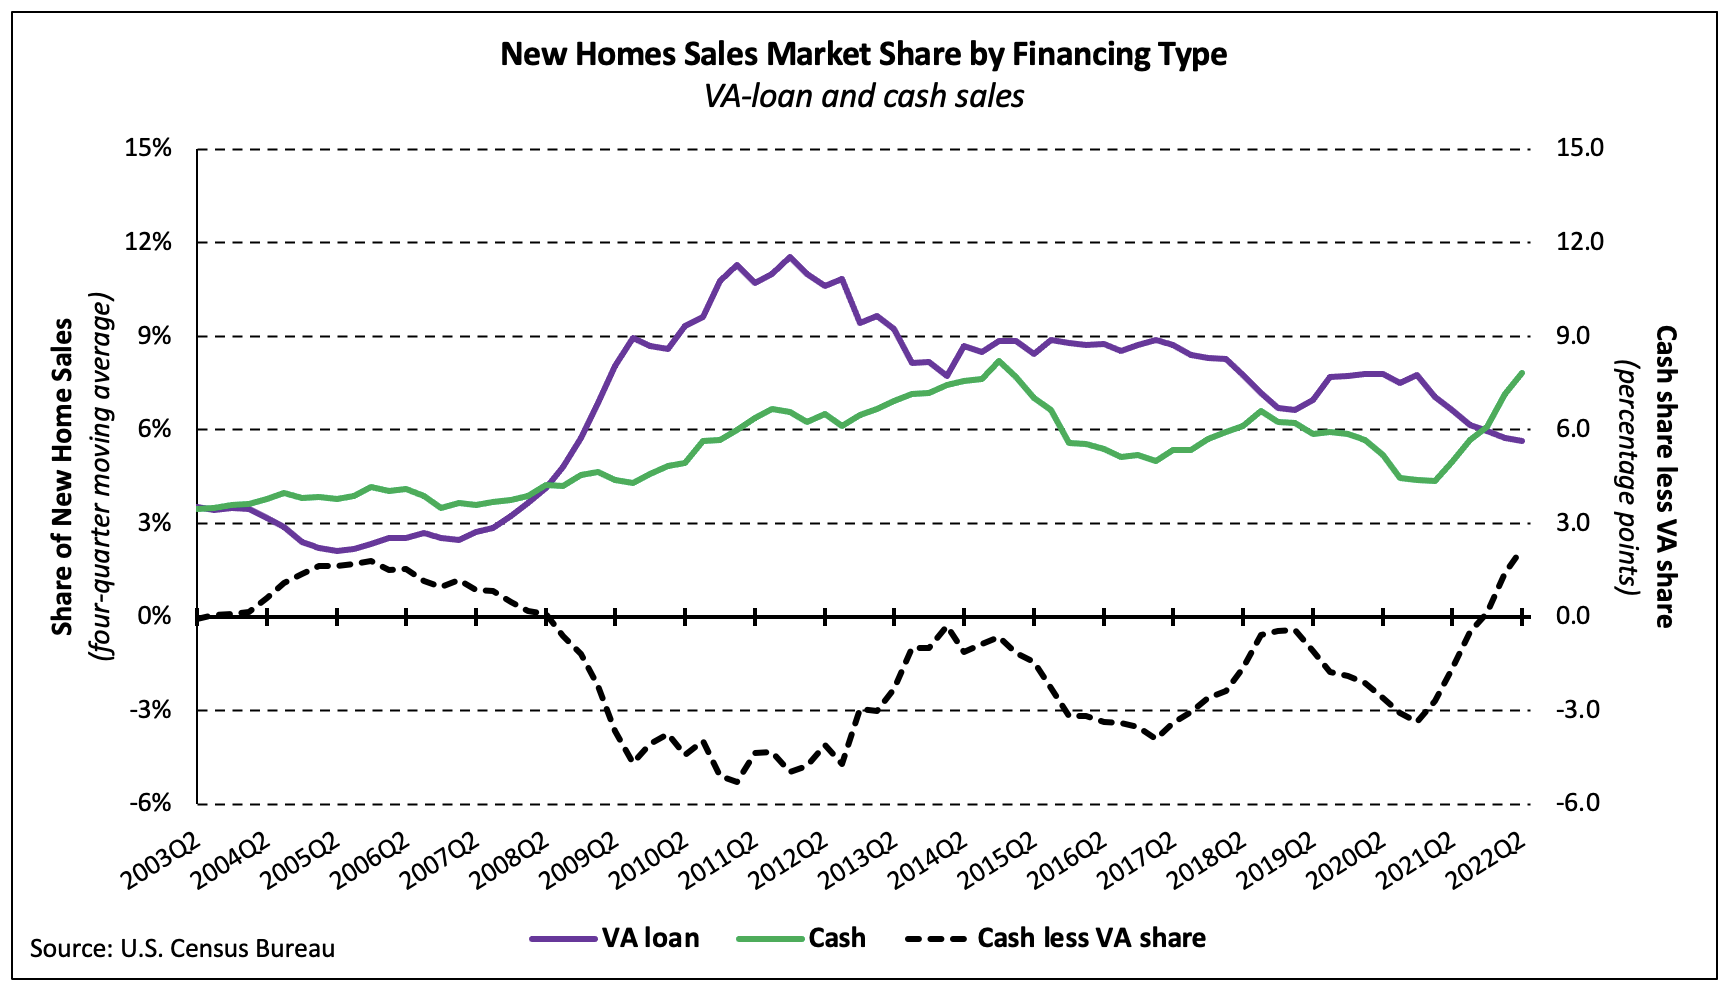
The four-quarter moving average share of all-cash new home sales has exceeded that of VA loan backed sales each of the last three quarters. From Q2 2008 through Q3 2021, the cash share had been smaller than the VA share. The second quarter of 2008 was preceded by 24 consecutive quarters during which the four-quarter MA share of cash sales was larger than that of VA-backed sales.
Although cash sales make up a small portion of new home sales, they constitute a larger share of existing home sales. According to estimates from the National Association of Realtors, 25% of existing home transactions were all-cash sales in June 2022, the same share as in May and up from 23% in June 2021.
The average interest rate of a 30-year fixed rate mortgage increased 103 basis points, quarter-over-quarter—to its highest end-of-quarter reading since Q2 2020. Over the last two quarters, the average rate of a conventional 30-year FRM has spiked 259 basis points. Stock market returns (proxied by the S&P 500®) in the second quarter were -16.4%, quarter-over-quarter, and -11.9% year-over-year. The recent combination of rising mortgage rates and poor stock returns likely contributed to the decline in the conventional loan market share as well as the nominal decrease in cash purchases.
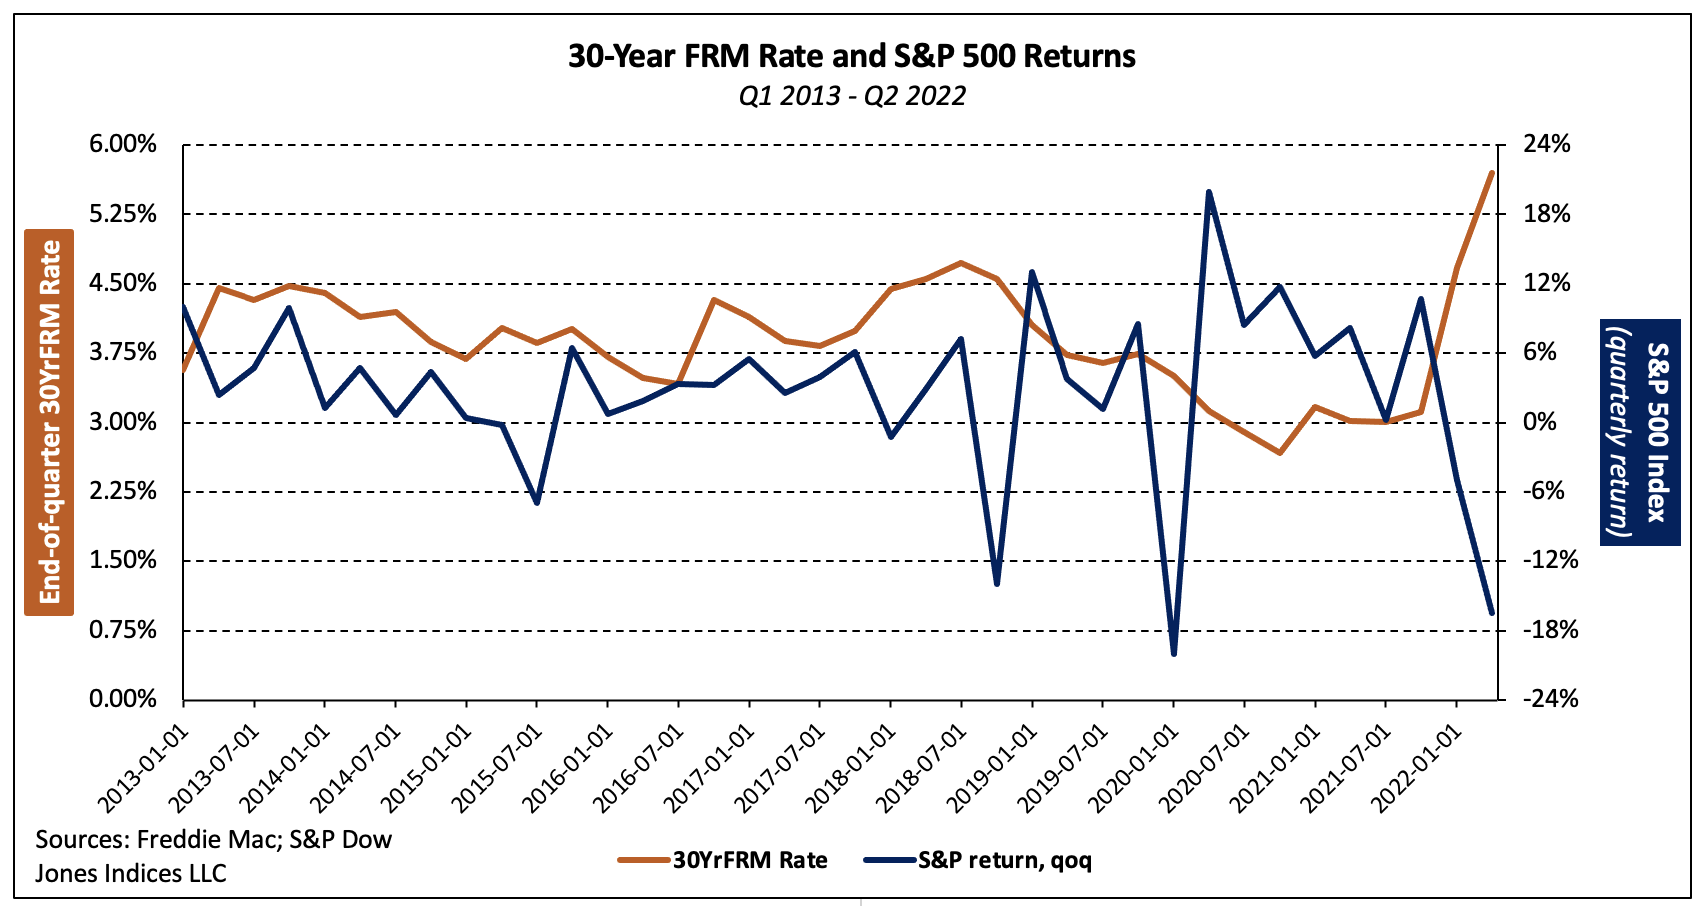
Each of these factors plays an important role in the dynamics among market share by type of financing. Higher stock returns and the resulting increased wealth aids borrowers in the underwriting process as well as increasing the down payment a household can afford (should they cash out some of their portfolio).
Low mortgage rates improve the odds that a given loan will be approved, all else held equal, as they keep monthly payments lower than they would otherwise be. As the monthly payment for a loan of a certain amount decreases, it becomes less likely that the future payments would increase the borrower’s debt-to-income ratio above a financial institution’s risk threshold.
Different sources of financing also serve distinct market segments, which is revealed in part by the median new home price associated with each. In the second quarter, the national median sales price of a new home was $440,300. Split by types of financing, the median prices of new homes financed with conventional loans, FHA loans, VA loans, and cash were $484,900, $370,600, $414,500, and $456,500, respectively.
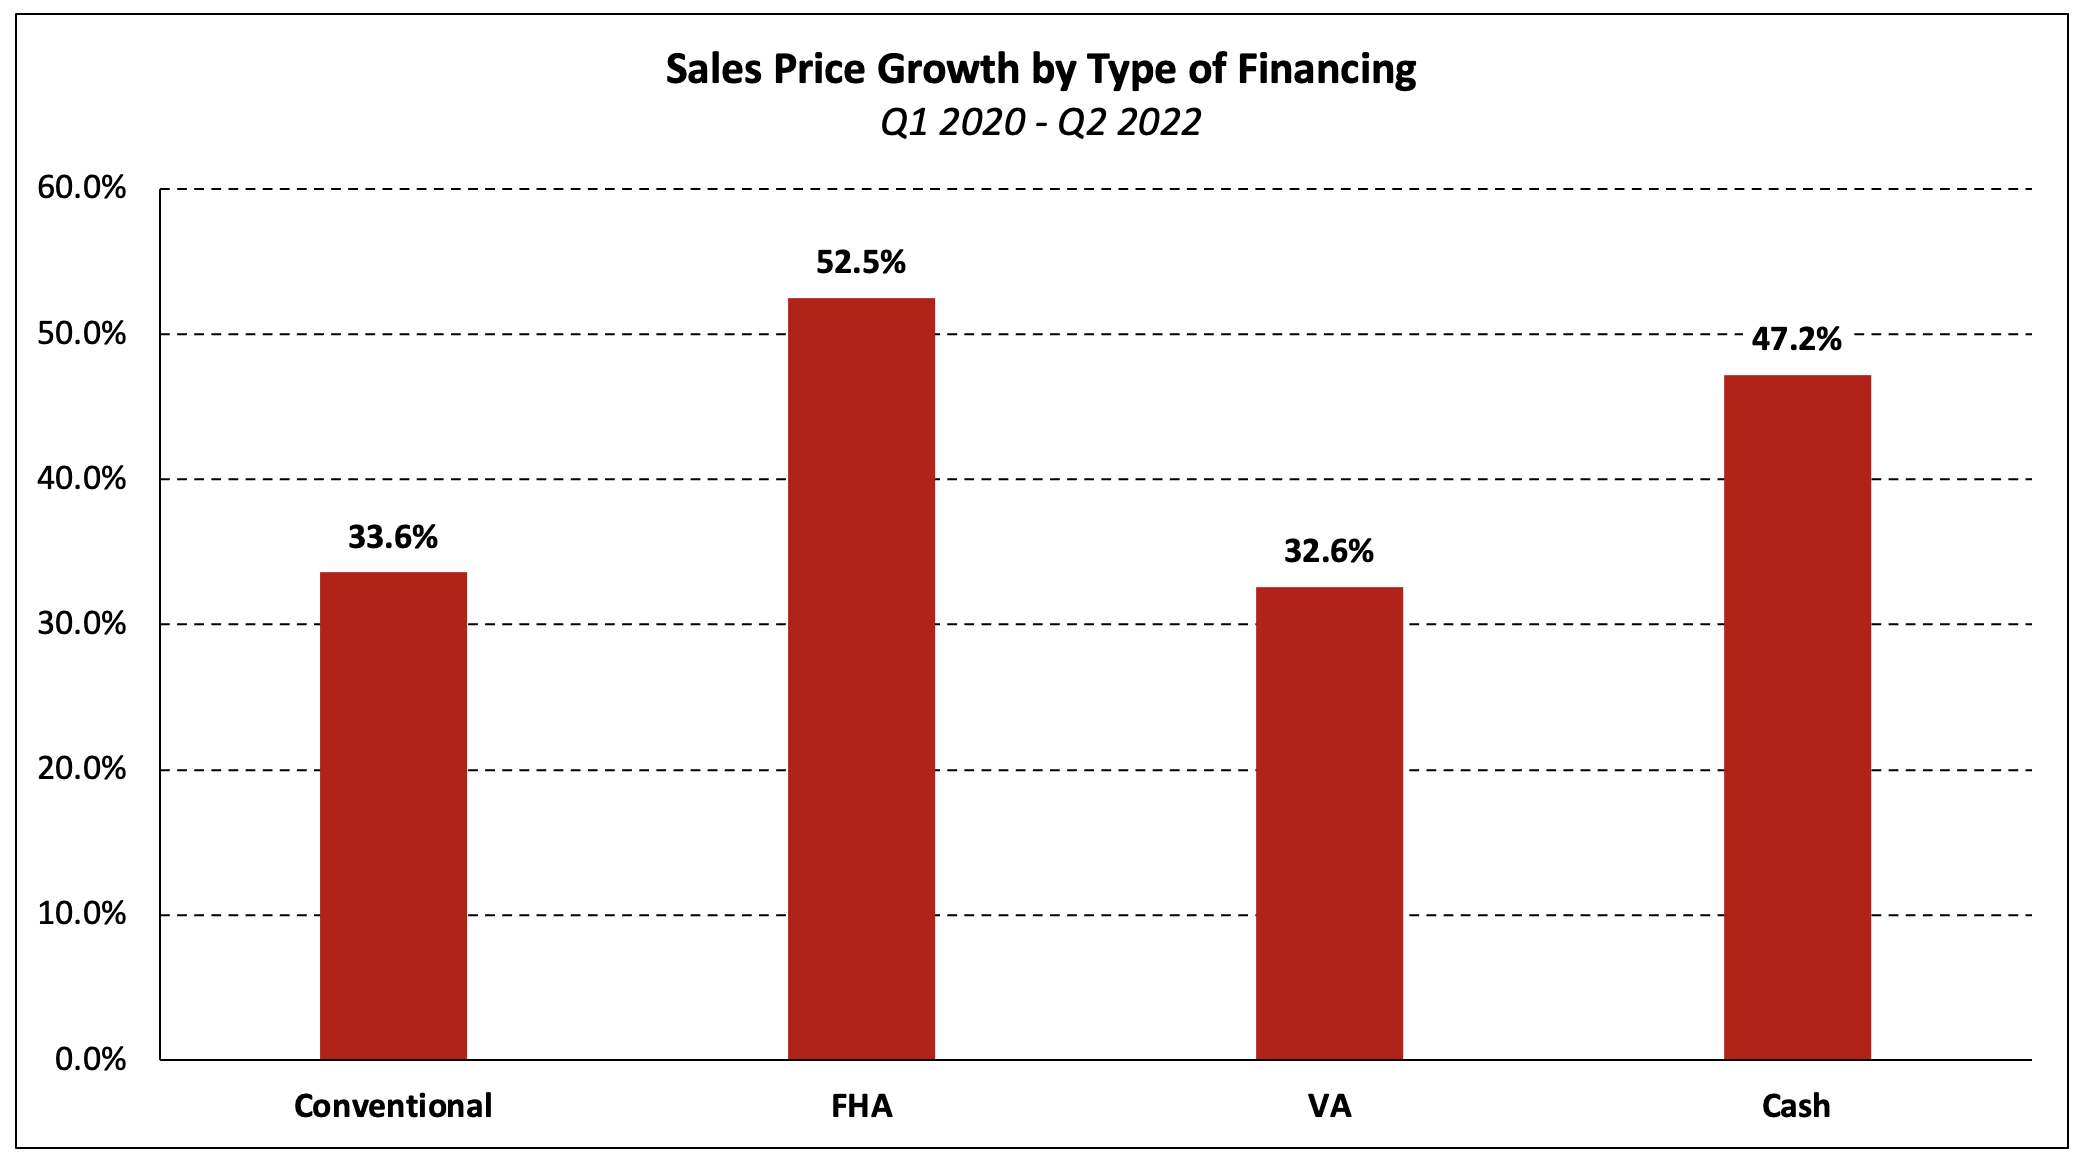
Since the first quarter of 2020, the median sales price of a new home has increased 33.8% but price growth has been uneven across the four financing types. The price of a new home purchased with an FHA loan has climbed 52.5% over the period while VA-backed purchase prices have risen 32.6%.
Discover more from Eye On Housing
Subscribe to get the latest posts sent to your email.
