As described in a previous post, NAHB recently released its 2024 Priced-Out Estimates showing 103.5 million households are not able to afford a median priced new home and an additional 106,031 households would be priced out if the price goes up by $1,000. This post focuses on the related U.S. housing affordability pyramid, showing how many households have enough income to afford homes at various price thresholds.

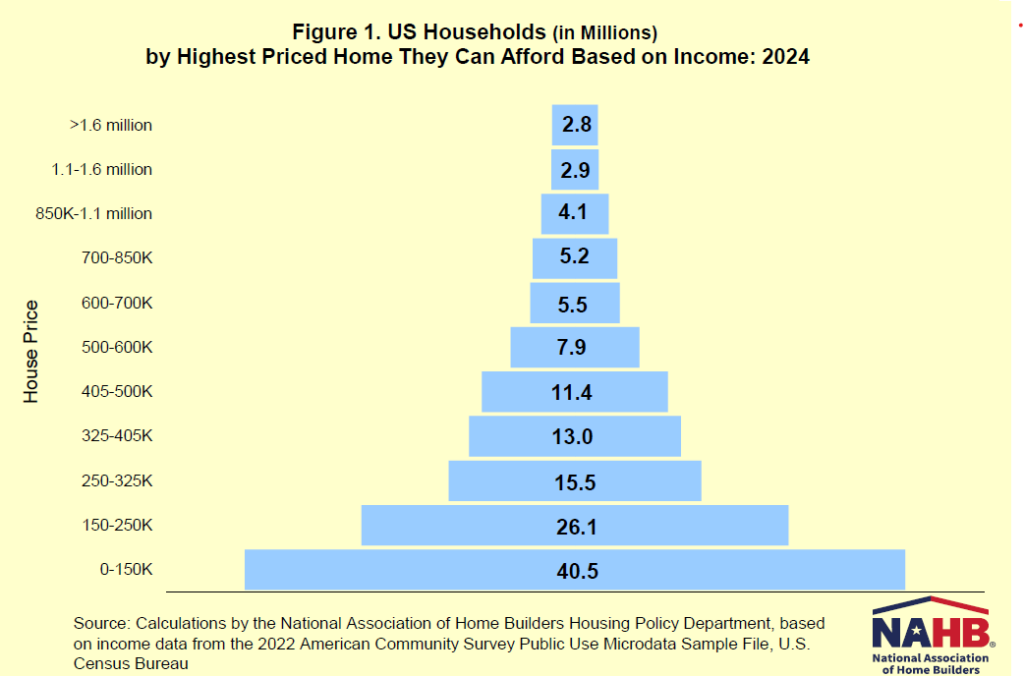
NAHB uses the standard underwriting assumptions to create a housing affordability pyramid showing the number of households able to purchase a home at each step. For example, the minimum income required to purchase a $150,000 home at the mortgage rate of 6.5% is $45,975. In 2024, about 40.5 million households in the U.S. are estimated to have incomes no more than that threshold and, therefore, can only afford to buy homes priced no more than $150,000. These 40.5 million households form the bottom step of the pyramid (Figure 1). Of the remaining households who can afford a home priced at $150,000, 26.1 million can only afford to pay a top price of somewhere between $150,000 and $250,000 (the second step on the pyramid). Each step represents a maximum affordable price range for fewer and fewer households. Housing affordability is a great concern for households with annual income at the lower end of the distribution.
The top step of the pyramid shows that around 3 million households can buy a home priced above $1.6 million. While this market is significant and important, market analysts should never only focus on those households to the exclusion of the larger number of Americans with more modest incomes that support the pyramid’s base.
Discover more from Eye On Housing
Subscribe to get the latest posts sent to your email.
