How do homes built-for-rent differ from more common for-sale new single-family homes? This is an important question given recent attention on the built-for-rent sector of the residential construction industry.
Second quarter data for 2019 reveal that approximately 42,000 homes were built-for-rent over the last year, representing about 5% of single-family construction. Though this figure continues to trend modestly higher as affordability headwinds generate demand for rental housing, the share of built-for-rent single-family homes remains a small percentage of the overall market.
NAHB analysis of Census data finds the following differences between for-sale and new single-family homes built-for-rent (SFBFR):
- SFBFR are typically smaller with fewer bedrooms and bathrooms.
- SFBFR are more likely to be a single-story building.
- SFBFR are seven times more likely to be a townhouse (single-family attached).
- SFBFR are more likely to be located on a smaller lot.
- SFBFR are almost all wood-framed.
- SFBFR are more likely to have a vinyl siding exterior and less likely to have stucco.
- SFBFR are more likely to have a one-car garage or no garage.
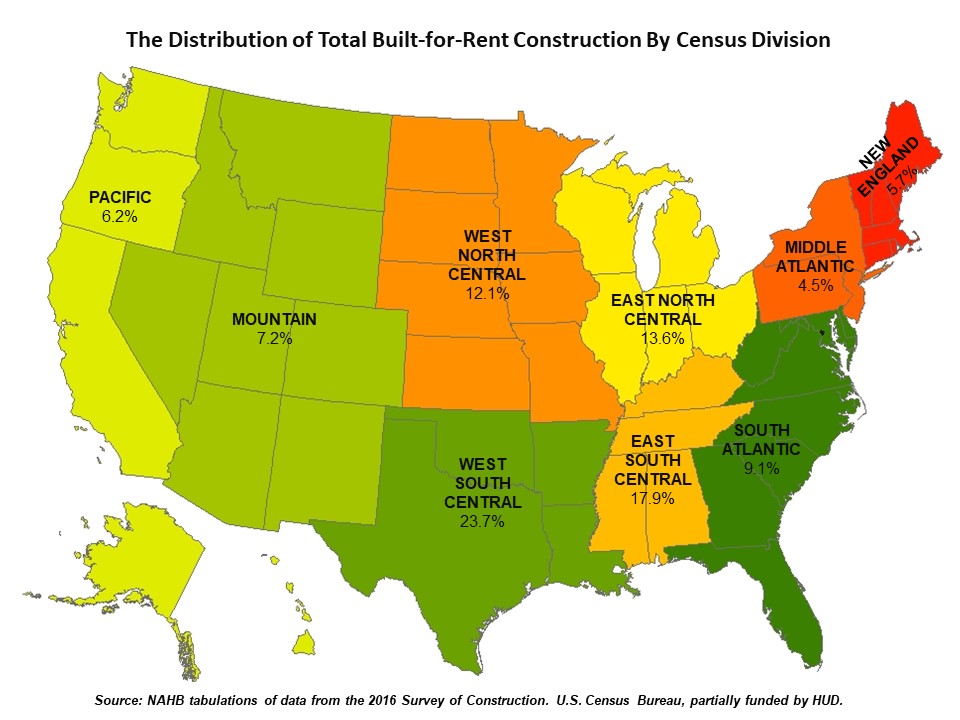
- The highest share and count of SFBFR construction is found in the West South Central Census division (Texas, Oklahoma, Arkansas and Louisiana).
- Although a small share of the total, SFBFR are more likely to be age-restricted.
- SFBFR are more likely to have a smaller construction permit value but have many units with permit values above $300,000.
- Average construction time is slightly longer for SFBFR homes.
This analysis uses the 2016 Census Bureau Survey of Construction (SOC) microdata, which represents the latest data available. Additionally, it is important to note that the following estimates are focused on averages and distributions, so individual homes or communities may vary from larger trends.
Home Size
Single-family built-for-rent homes tend to be smaller than their for-sale peers. These differences are apparent in terms of aggregate home size, as well as constructed features of the house.
The median square footage of SFBFR homes in 2016 was 1,500 square feet, significantly smaller than the 2,419 median square feet of for sale-builds. Moreover, it was also notably lower than the median for townhouses (approximately 2,000 square feet).
Eighty percent of SFBFR homes are under 2,000 square feet, compared to just 28% of built for-sale new construction. Only 8% of SFBFR homes are above 2,400 square feet, the size of a typical for-sale new home.
A smaller home implies other design differences. Just over half (52%) of SFBFR homes had just one or two bedrooms, compared to just 6% of for-sale homes. Further, 93% of SFBRF homes had three of fewer bedrooms, compared to 50% of for-sale housing.
Similarly, 20% of SFBFR homes had just one full bathroom, compared to less than 1% of for-sale homes. Nearly all SFBFR homes (96%) had just two bathrooms or fewer, compared to 61% of for-sale single-family homes. A full 70% of SFBFR homes had no half-baths, in contrast to 50% of for-sale homes.
In terms of basement space, 8% of SFBFR residences had a full or partial basement. The for-sale new construction market posted a higher share (26%) with a full or partial basement.
And with respect to entry space, there are measurable differences. A two-story foyer was found in 35% of new for-sale single-family homes. This was less common in SFBFR homes, where just 10% of homes had this feature. Other amenity features differ as well. To take one example, only one out of ten SFBFR homes was built with a fireplace. The for-sale home figure was 52%.
Structure and Lot Type
Given that SFBFR homes are smaller, they also possess certain structural differences. For example, 61% of SFBFR homes have just one story. Basements do not count as a story for this analysis. For the for-sale class, 40% of homes had just one story. Interestingly, as SFBFR are much more likely to be townhouses, the share of such homes that are three or more stories (5%) was close to the for-sale class (6%).
In terms of structure type, 77% of SFBFR homes were built as townhouses or single-family attached housing. For the for-sale single-family market, the comparable share is 11% for this data period. This was the largest single-difference between the for-rent and for-sale classes of new single-family homes. Effectively, this type of SFBFR housing is the bridge between rental multifamily residences and entry-level for-sale housing.
Not surprisingly, lot sizes tend to be smaller for SFBFR residences. The median lot size for such homes was 6,200 square feet. This is smaller than the 8,500 square feet for a typical for-sale build. Given these statistics, on a median basis, nine SFBFR home lots could fit on a football field, compared to less than seven of the typical for-sale product. Meanwhile, 82% of SFBFR homes were on lots of less than 11,000 square feet, while the full-sale comparison share stood at 69%.
The overwhelming majority of SFBFR homes and for-sale homes are wood framed, with each type registering 98% and 90%, respectively. One measurable difference was the share of concrete frames, with for-sale homes posting a 9% share to just 2% for SFBFR.
With respect to exteriors, 44% of SFBFR homes used vinyl siding. The share was 25% for the for-sale sector. The second most common exterior for SFBFR residences was brick or brick veneer, representing 28% of builds. This share was 22% for the for-sale class. A large difference was found for stucco exteriors — 28% of for-sale homes had this exterior but just 11% of SFBFR homes possessed stucco.
One quarter of SFBFR residences had a one-car garage (compared to just 6% of the for-sale category) and 40% had a two-car garage (68% of the for-sale market). Meanwhile, 35% of SFBFR homes had no parking, street parking or a carport.
Location
According to the 2016 data, SFBFR homes were relatively more concentrated in the center of the U.S. For example, the Census Division containing the higher share of such homes was the West South Central Division (Texas, Oklahoma, Arkansas, and Louisiana), claiming 24% of the total for a count of approximately 9,000 homes.
The second largest division was the neighboring East South Central (Kentucky, Tennessee, Alabama, and Mississippi) with a 18% share or about 7,000 homes.

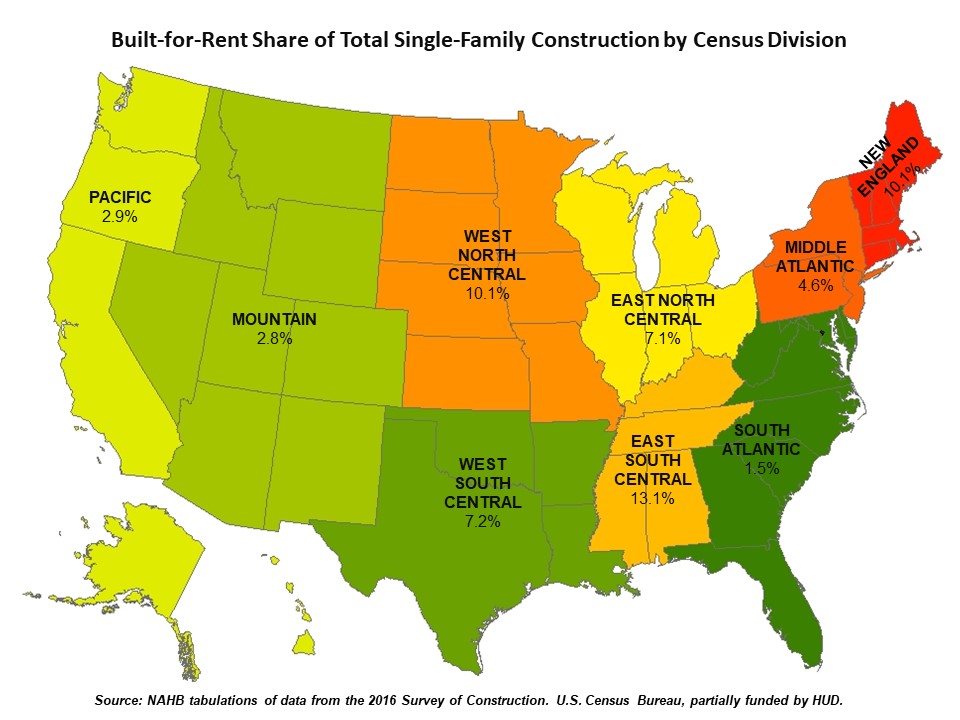
However, as a share of total homes built, the high intensity area for single-family construction was the East South Central division (with 13% of single-family homes built as SFBFR), followed by New England with 10%.

These results are interesting because SFBFR is often tied to challenges for housing affordability in coastal, inefficiently regulated and/or high population growth areas. This is not what the 2016 data shows, indicating opportunity for market growth in other areas of the U.S.
Additionally, SFBFR homes are more likely to fall outside metropolitan statistical areas (MSAs), or large metro areas with common economic links. Eighteen percent of SFBFR homes were built outside an MSA, compared to just 5% of for-sale builds.
Finally, SFBFR homes were also more likely to be a part of an age-restricted community, with one out of 10 homes built for such developments. The age-restricted share of for-sale new single-family was just 4%.
Construction Cost and Time
Given the size and geography details provided above, it is no surprise that the typical permitted construction value (does not include the lot) for SFBFR homes is lower than the for-sale group. The 2016 median SFBFR home permit value was $175,000. This is lower than the $211,000 permit value of for-sale construction. In fact, 40% of SFBFR homes had a permit value of less than $150,000. Only 26% of for-sale single-family had a permit value of less than $150,000.
However, it is worth noting that for the $300,000 or higher permit value, SFBFR homes held a relatively high 35% share, compared to 25% of the for-sale class. Thus, SFBFR homes represent an outsized share at both the lower and higher level of construction permit values. For example, the average (mean) permit value of a for-sale single-family home in 2016 was $246,000 vs. approximately $321,000 for an SFBFR. The built-for-rent homes clearly have a greater variance of housing types and construction costs.
These contrasts lead to a divergence in construction times as well. SFBFR homes actually had slightly longer construction times. The average construction period of a for-sale single-family home was 4.87 months in 2016. For SFBFR residences, it was 5.73 months. Fifty five percent of SFBFR homes were constructed in five or fewer months, compared to 71% of for-sale homes. Fourteen percent of SFBFR homes had a construction time of at least nine months, vs. 6% of for-sale homes.
Outlook for Built-for-Rent
Recent declines in mortgage interest rates will, at the margin, reduce demand for rental single-family homes in the coming months. However, the share of built-for-rent single-family residences as a share of total construction remains elevated due to mounting housing affordability challenges. Moreover, lower mortgage interest rates do not help mitigate the challenge of accumulating a downpayment in high cost, low supply housing markets. In such environments, some families will seek to rent a single-family home as an alternative to a multifamily apartment.
NAHB forecasts that the count and the share of SFBFR will rise over the coming years, but this market segment will remain a relatively small share of the overall home building industry. The data presented here also indicates that growth prospects are likely to be concentrated in certain markets that possess relatively lower current shares of SFBFR construction
Discover more from Eye On Housing
Subscribe to get the latest posts sent to your email.

Extraordinary good piece of research. How can we access the actual data behind this report?
Thanks Charles. The underlying data source is here: https://www.census.gov/construction/chars/microdata.html. The 2016 microdata.
Thank you Robert.
Great Information with lots of stats. Thanks for sharing!
Thank you Robert!