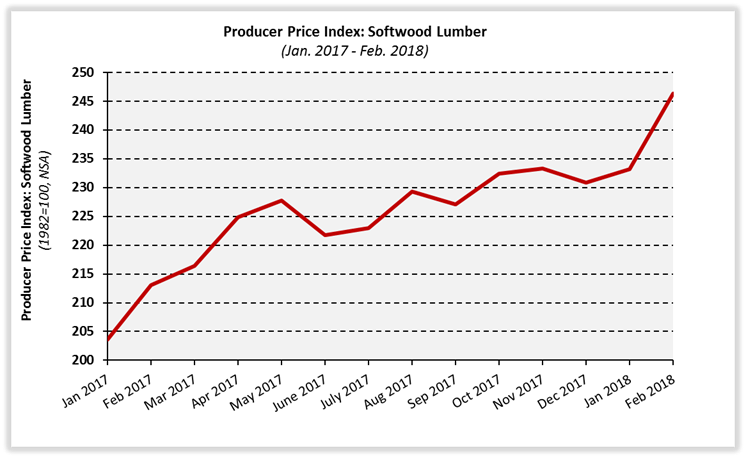
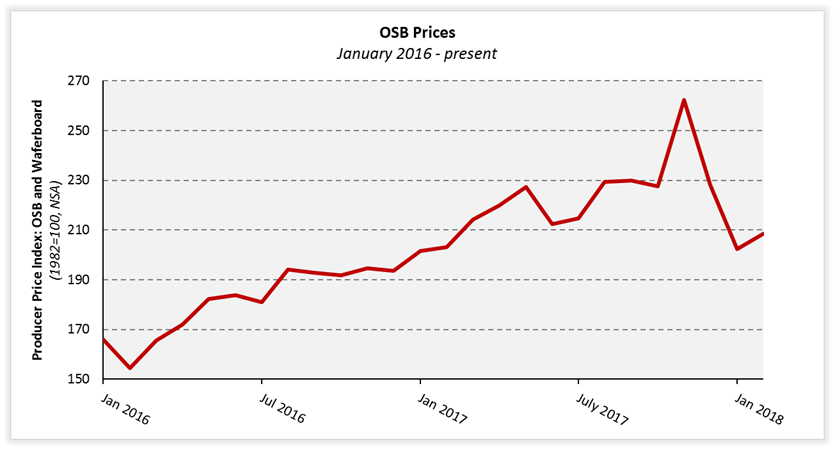
Prices paid for building materials increased across the board in February. The indexes for softwood lumber (+5.6%), gypsum products (+4.2%), OSB (+3.1%), ready-mix concrete (+0.4%), and inputs to residential construction less labor (+1.0%) all increased, according to the latest Producer Price Index (PPI) release by the Bureau of Labor Statistics.
The percentage increase in softwood lumber prices (not seasonally adjusted) was the biggest since 2012 according to PPI historical data. The last time prices rose nearly this sharply was February 2017 (+4.7%), which marked the first month of price increases after the last softwood lumber agreement expired.

The increase in OSB prices follows a two-month, 22.9% decrease (NSA). After the brief reprieve, however, OSB prices in February 2018 are now 35.0% higher than they were two years prior.

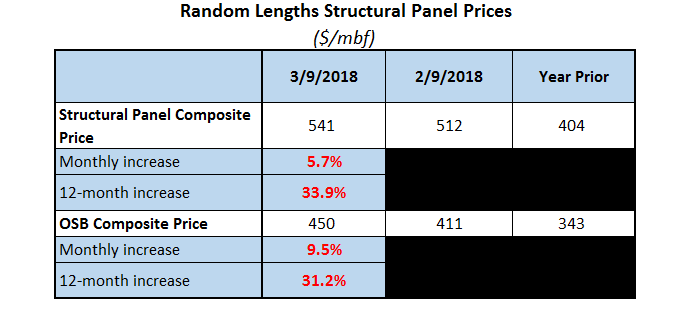
Due to methodology, OSB and softwood lumber data in the PPI tend to lag market conditions. According to Random Lengths, the price of OSB has risen more in recent weeks than PPI data suggest. These increases will likely be captured in next month’s PPI release. Price information for structural panels as recent as early March 2018 is shown below.

Two important factors drive disparities between price changes builders have experienced and the PPI index changes:
1. The producer price index tracks prices paid by wholesalers, distributers, and retailers rather than what those businesses charge customers.
2. The index does not include prices paid for Canadian products as it does not include imports (just as the consumer price index does not reflect prices paid for exports).
BLS also reported that prices paid for gypsum products rose 4.2% (seasonally adjusted) in February, the largest increase since April 2016. Although prices increased substantially in February 2017 as well (+3.2%), the average monthly increase during the intervening 11 months was 0.3%. During that period, prices advanced more than 1% only once (+1.6% in June 2017).
The economy-wide PPI increased 0.2% in February. A 0.1% decline in prices paid for goods was more than offset by the 0.3% increase in the index for final demand services. Prices paid for core goods (i.e. goods excluding food and energy) rose 0.2% and the index for final demand less food, energy, and trade services climbed 0.4%.
Most of the advance in prices paid for services is traceable to a 0.3% increase in the index for services less trade, transportation, and warehousing. A 3.7% increase in the price paid for traveler accommodation services was a major factor, while the indexes for automotive fuel retailing, food retailing, and airline passenger services also moved higher. In contrast, margins for machinery, equipment, parts, and supplies wholesaling fell 1.4 percent.
The 0.1% decline in prices for final demand goods was the first decrease since May 2017. Prices for fresh and dry vegetables led the February decrease, dropping 27.1%. The indexes for gasoline, diesel fuel, and light motor trucks also fell, while prices paid for residential natural gas increased.
Many thanks to Ken Simonson, Ph.D., Chief Economist of the Associated General Contractors of America, for his comments and suggestions.
Discover more from Eye On Housing
Subscribe to get the latest posts sent to your email.

