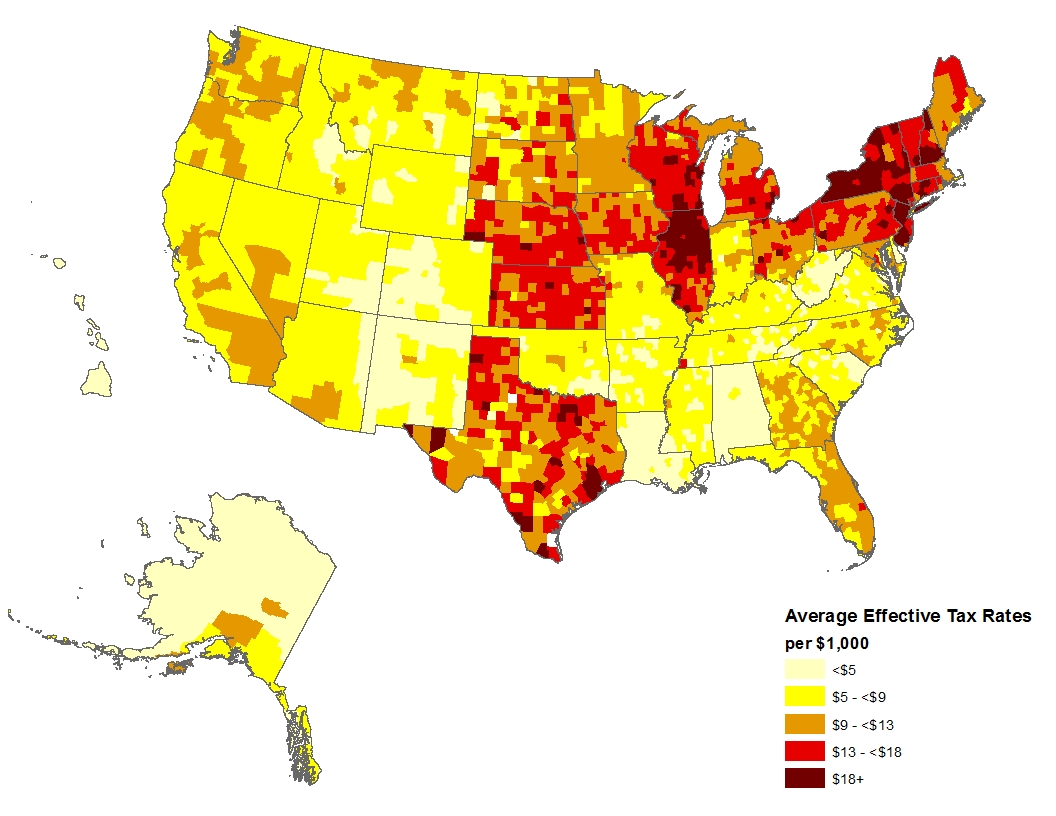
A new NAHB Economics research article shows that the effective real estate tax rates vary substantially across and within counties, with the highest rate area displaying rates that are often multiple times higher than the lowest rate areas within the same county.
An “effective property tax rate” is the amount of property tax paid divided by the value of the home as reported by home owners, thus giving an apples-to-apples comparison of true tax burden for homes in various locations. The alternative to an effective rate measurement is to compare statutory tax rates, which can be misleading given differences in assessment rules, tax credits, lags in accurate assessments by taxing jurisdiction and other complicating factors.

The report presents tables of effective property tax rates for more than 3,100 counties, mapped above, including the lowest and highest tract rates within each county. At the low end of the national spectrum, there are Louisiana parishes with twelve of them registering property tax rates that are effectively under $2 dollars per $1,000 of value. At the high end, there are Orleans and Monroe Counties, New York and Camden County, New Jersey with property tax rates averaging close to $29.
The regional location remains a strong factor in explaining substantial differences in effective tax rates with South typically registering some of the lowest rates, with the exception of Texas, and Northeast and Midwest registering some of the highest rates in the nation. This is a reflection of a well-known and long-established tradition of southern states to rely less on real estate taxes as a source of government revenue.
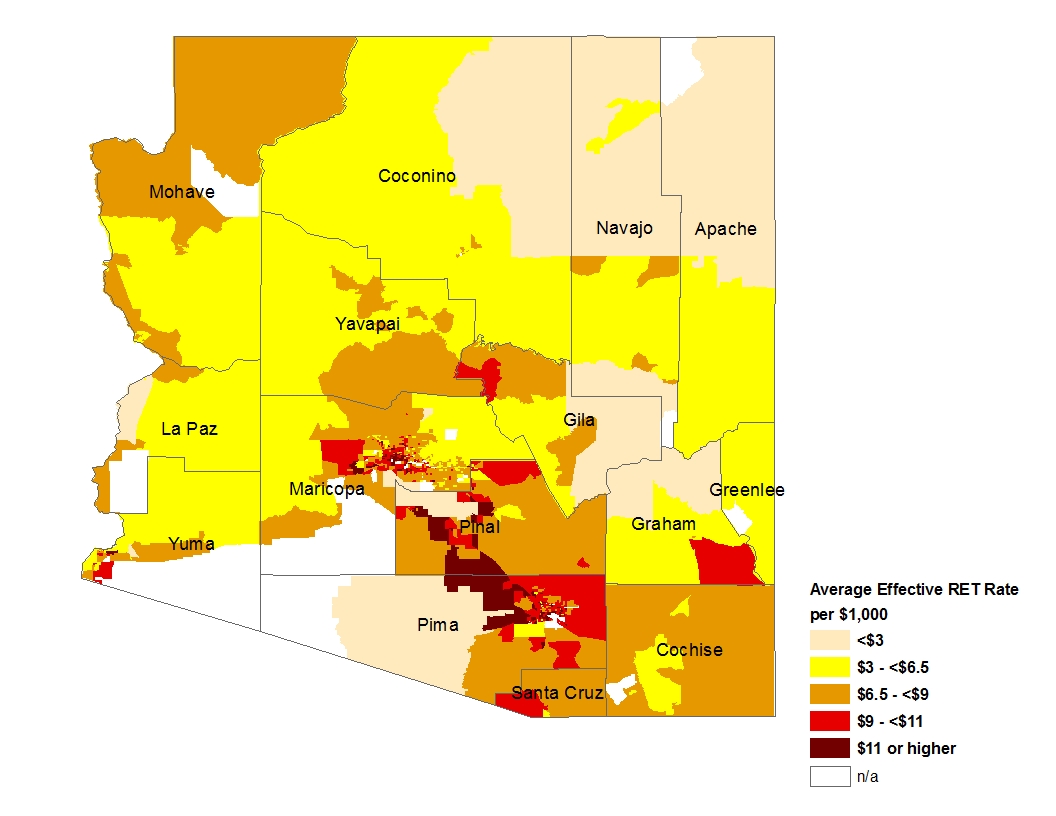
Drilling further down geographically, the analysis reveals widespread variation in effective property tax rates across tracts (the main way the Census Bureau subdivides counties). Map below illustrates the intra-county variation using the average effective real estate tax rates for Arizona counties and tracts as an example.

The report shows that in addition to the regional location, varying household income, home values, how recently the homes have been purchased, presence of households that are exempt from paying property taxes, and the share of households with children under 18 – all help explain the effective tax rate variation across tracts.
The research should be useful for prospective homebuyers and businesses in the housing industry interested in comparing effective property tax payments across narrowly defined geographic areas.
The complete NAHB report is available to the public as a courtesy of Housing Economics Online.
Discover more from Eye On Housing
Subscribe to get the latest posts sent to your email.

This information is not too suprising, but it is interesting and I would like to know more on how that the number of home occupants under the age of 18 effects property taxes.
Since school districts are typically larger than tracts and often overlap with counties, the county share of households with children under 18 was used in the analysis. The results confirmed the expected positive relationship between the share of households with children under 18 and property tax rates, meaning that tracts belonging to counties with proportionately more households with children tend to have higher property tax rates. For more details, you can check the original research here