The homebuyer tax credit program is in the past for the housing industry. But we can begin to take a look back at the impact of the program using Internal Revenue Service data from 2009 to map where the tax credit was claimed by homebuyers. As with the energy efficiency tax credits, the use of the homebuyer tax credit was used with varying degrees of intensity across the nation.
Just as a reminder, the three phases of the tax credit program were:
- April 8, 2008 thru December 31, 2008: A repayable 10%/$7,500 tax credit (i.e. no-interest loan) for first-time homebuyers
- January 1, 2009 thru November 6, 2009: A non-repayable 10%/$8,000 tax credit for first-time homebuyers
- November 7, 2009 thru September 30, 2010: The $8,000 first-time homebuyer credit plus a 10%/$6,500 tax credit for some repeat homebuyers
The 2009 IRS data that we use below are only for tax year 2009, so they do not in general reflect claims of the larger, third phase of the tax credit program. But they do give a sense of where the second phase was associated with home buying.
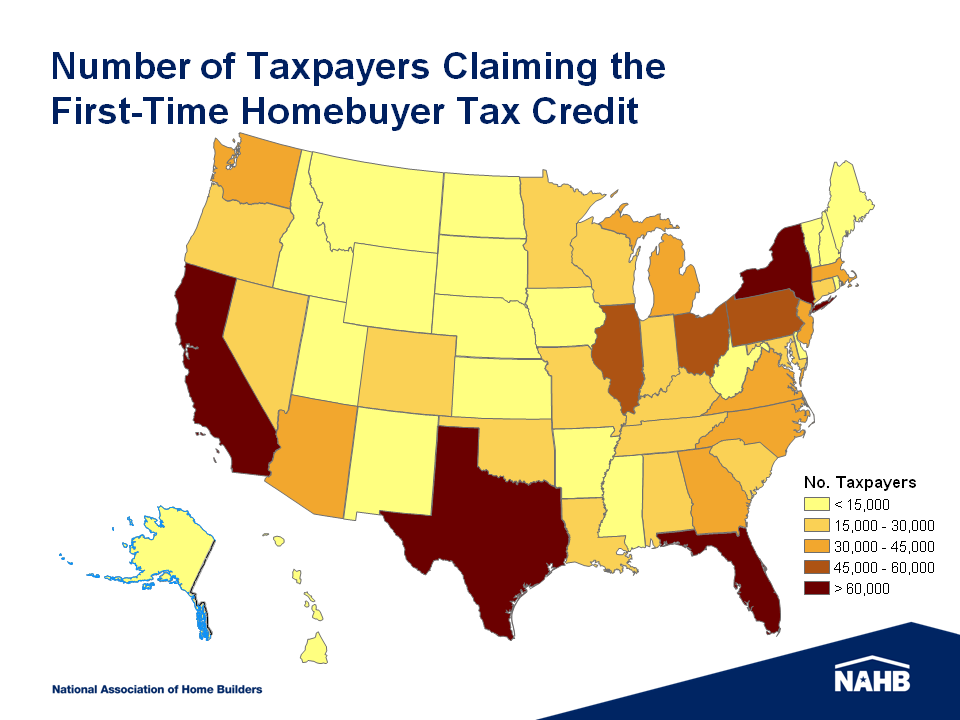
The following map provides counts by state of taxpayers who claimed the homebuyer tax credit in 2009. It is no surprise that the largest states (California, New York, Florida, and Texas) had the largest absolute number of taxpayers claiming the credit.
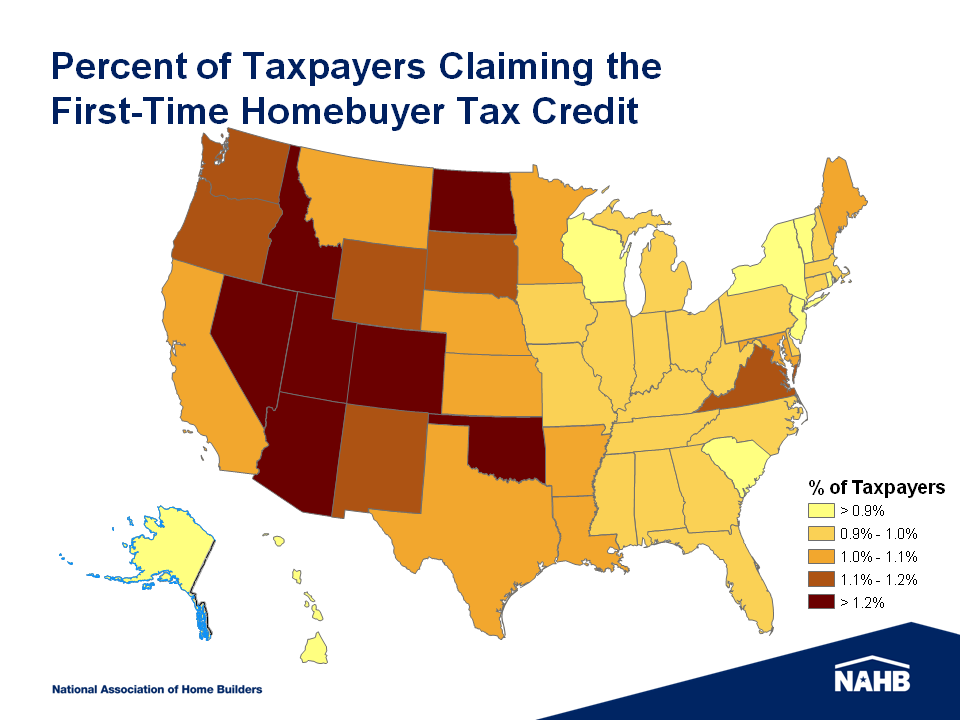
To provide a sense of scale and control for population size, the second map charts the percentage of taxpayers in each state in 2009 that claimed the homebuyer tax credit. This presentation changes the perspective, and suggests that there was a larger per capita use of the tax credit in western states, such as Nevada, Arizona, Colorado, Utah, and Idaho.
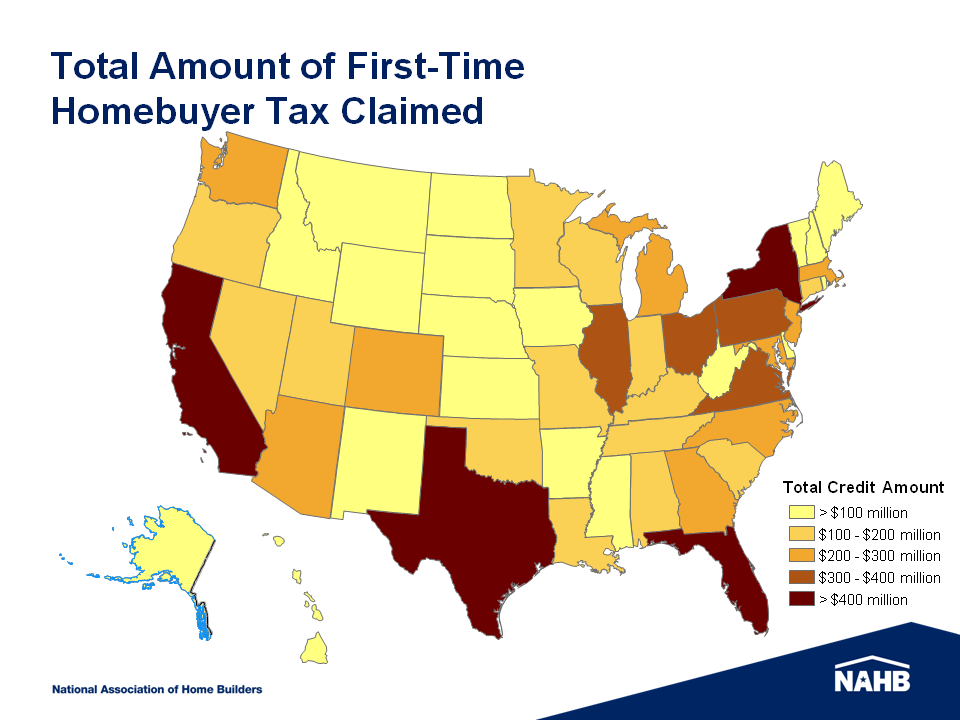
Finally, we can plot the aggregate amount of tax credits claimed in each state, with the results mirroring the first map of the absolute counts of taxpayers claiming the credit.
Overall for 2009, the tax credit was claimed by more than 1.4 million homeowners for a total tax benefit of $9.9 billion. When all phases of the tax credit are totaled with next year’s IRS data release, the total tax benefit is expected to be more than $25 billion.
While the tax credit program disappointed in the sense that the housing market remains depressed, it did create home sales that otherwise would not have taken place. If the current level of new home sales (approximately 300,000 at a seasonally adjusted annualized rate) represents the baseline level for the Great Recession, then new home sales were elevated by the tax credit, particularly the middle of 2009 and early 2010.
Using these data, the tax credit may have raised new home sales by 10% to 20% above the alternative baseline, with the range depending on how many sales were simply accelerated. But as the geographic data above indicates, these gains were likely not evenly spread across the country given the size of the tax credit as a share of local housing prices, the state share of first-time buyers, and the overall level of new home sales and building in each state.
Discover more from Eye On Housing
Subscribe to get the latest posts sent to your email.


4 thoughts on “Homebuyer Tax Credit Statistics”