As we enter into the last week of the 2010 tax filing season, it is a good time to look at some basic statistics concerning how construction firms, including home builders, organize for tax purposes and how much revenue they pay to the federal government. We will follow up this post over the next week with looks at the numbers involving specific housing tax rules and the overall state of tax receipts for the federal government.
The construction sector is dominated by small businesses, and how firms organize themselves and pay taxes reflects this decentralized character.
To generate the following statistics we use the IRS Statistics of Income integrated business tax data for years 1998 to 2007 (2007 is the latest available – data in future years will cover the complete effects of the Great Recession). The IRS publishes such data for industrial sectors, including construction, but unfortunately we cannot examine residential construction in isolation.
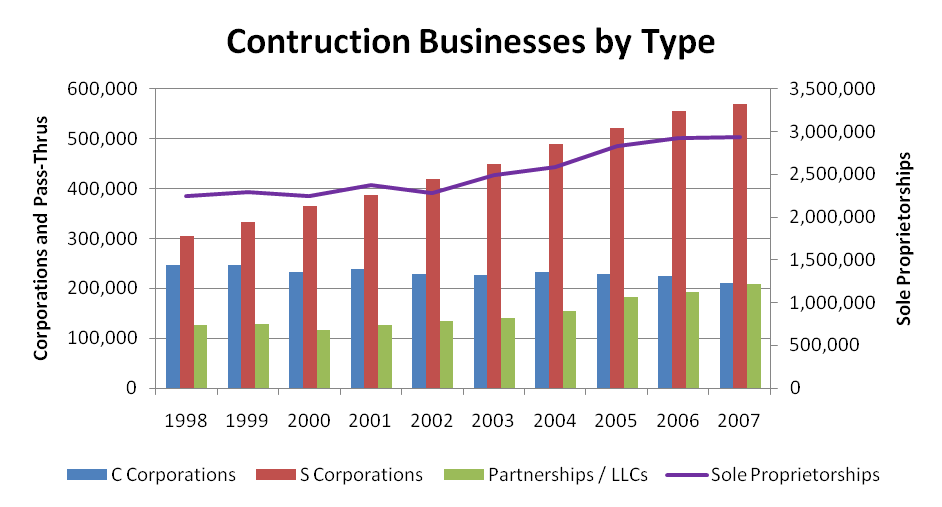
Nonetheless, for the geographically expansive construction sector, the leading form of business is sole proprietorship, numbering just about 3 million in 2007. This large number is due to independent contractors and trades workers. Among larger businesses, S Corporations continue to dominate in construction and grew during the boom years, reaching almost 570,000 in total in 2007. S Corporations offer the legal benefits of corporate status while providing pass-thru status for tax purposes. Limited Liability Corporations, which offer similar benefits, also grew in use during the period, with C Corporations declining.
Overall, in 2007 C Corporations represented about 5% of all firms in construction, with S Corporations at approximately 15%, partnerships at 5%, and sole proprietorships constituting the remaining 75%.
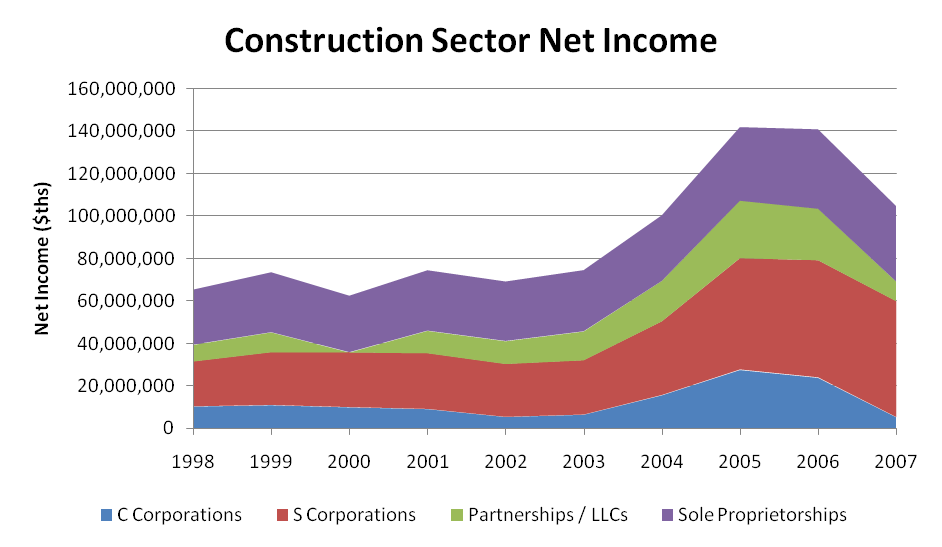
Examining net income, the boom and subsequent Great Recession come into focus. Aggregate net income soared in 2004 through 2006, with significant declines in 2007 (and into the current period, as future data releases will certainly confirm). Nonetheless, even in the down year of 2007, the construction sector reported almost $105 billion in taxable income and paid tens of billions of dollars in taxes.
The distribution of net income differs somewhat from the counts of business entities, especially with respect to S Corporations. For 2007, C Corporations represented 5% of the total net income, with S Corporations claiming a substantially larger share at 52% (compared to being just 15% of businesses). Partnerships reported 9% of net income and sole proprietorships had 34%.
This small business angle is not true for all sectors. For example, for the economy as a whole, S Corporations report only 14% of all net income, compared to the more than half of net income in the construction sector.
Given that most large, national construction firms, including home builders, are publicly traded C Corporations, these net income distribution shares reinforce the fact that construction is an industry dominated by small businesses, typically leaders in job creation. However, current tight lending conditions, including problems concerning AD&C loans, are blocking such economic expansion.
Discover more from Eye On Housing
Subscribe to get the latest posts sent to your email.


0 thoughts on “Tax Profile of the Construction Sector”