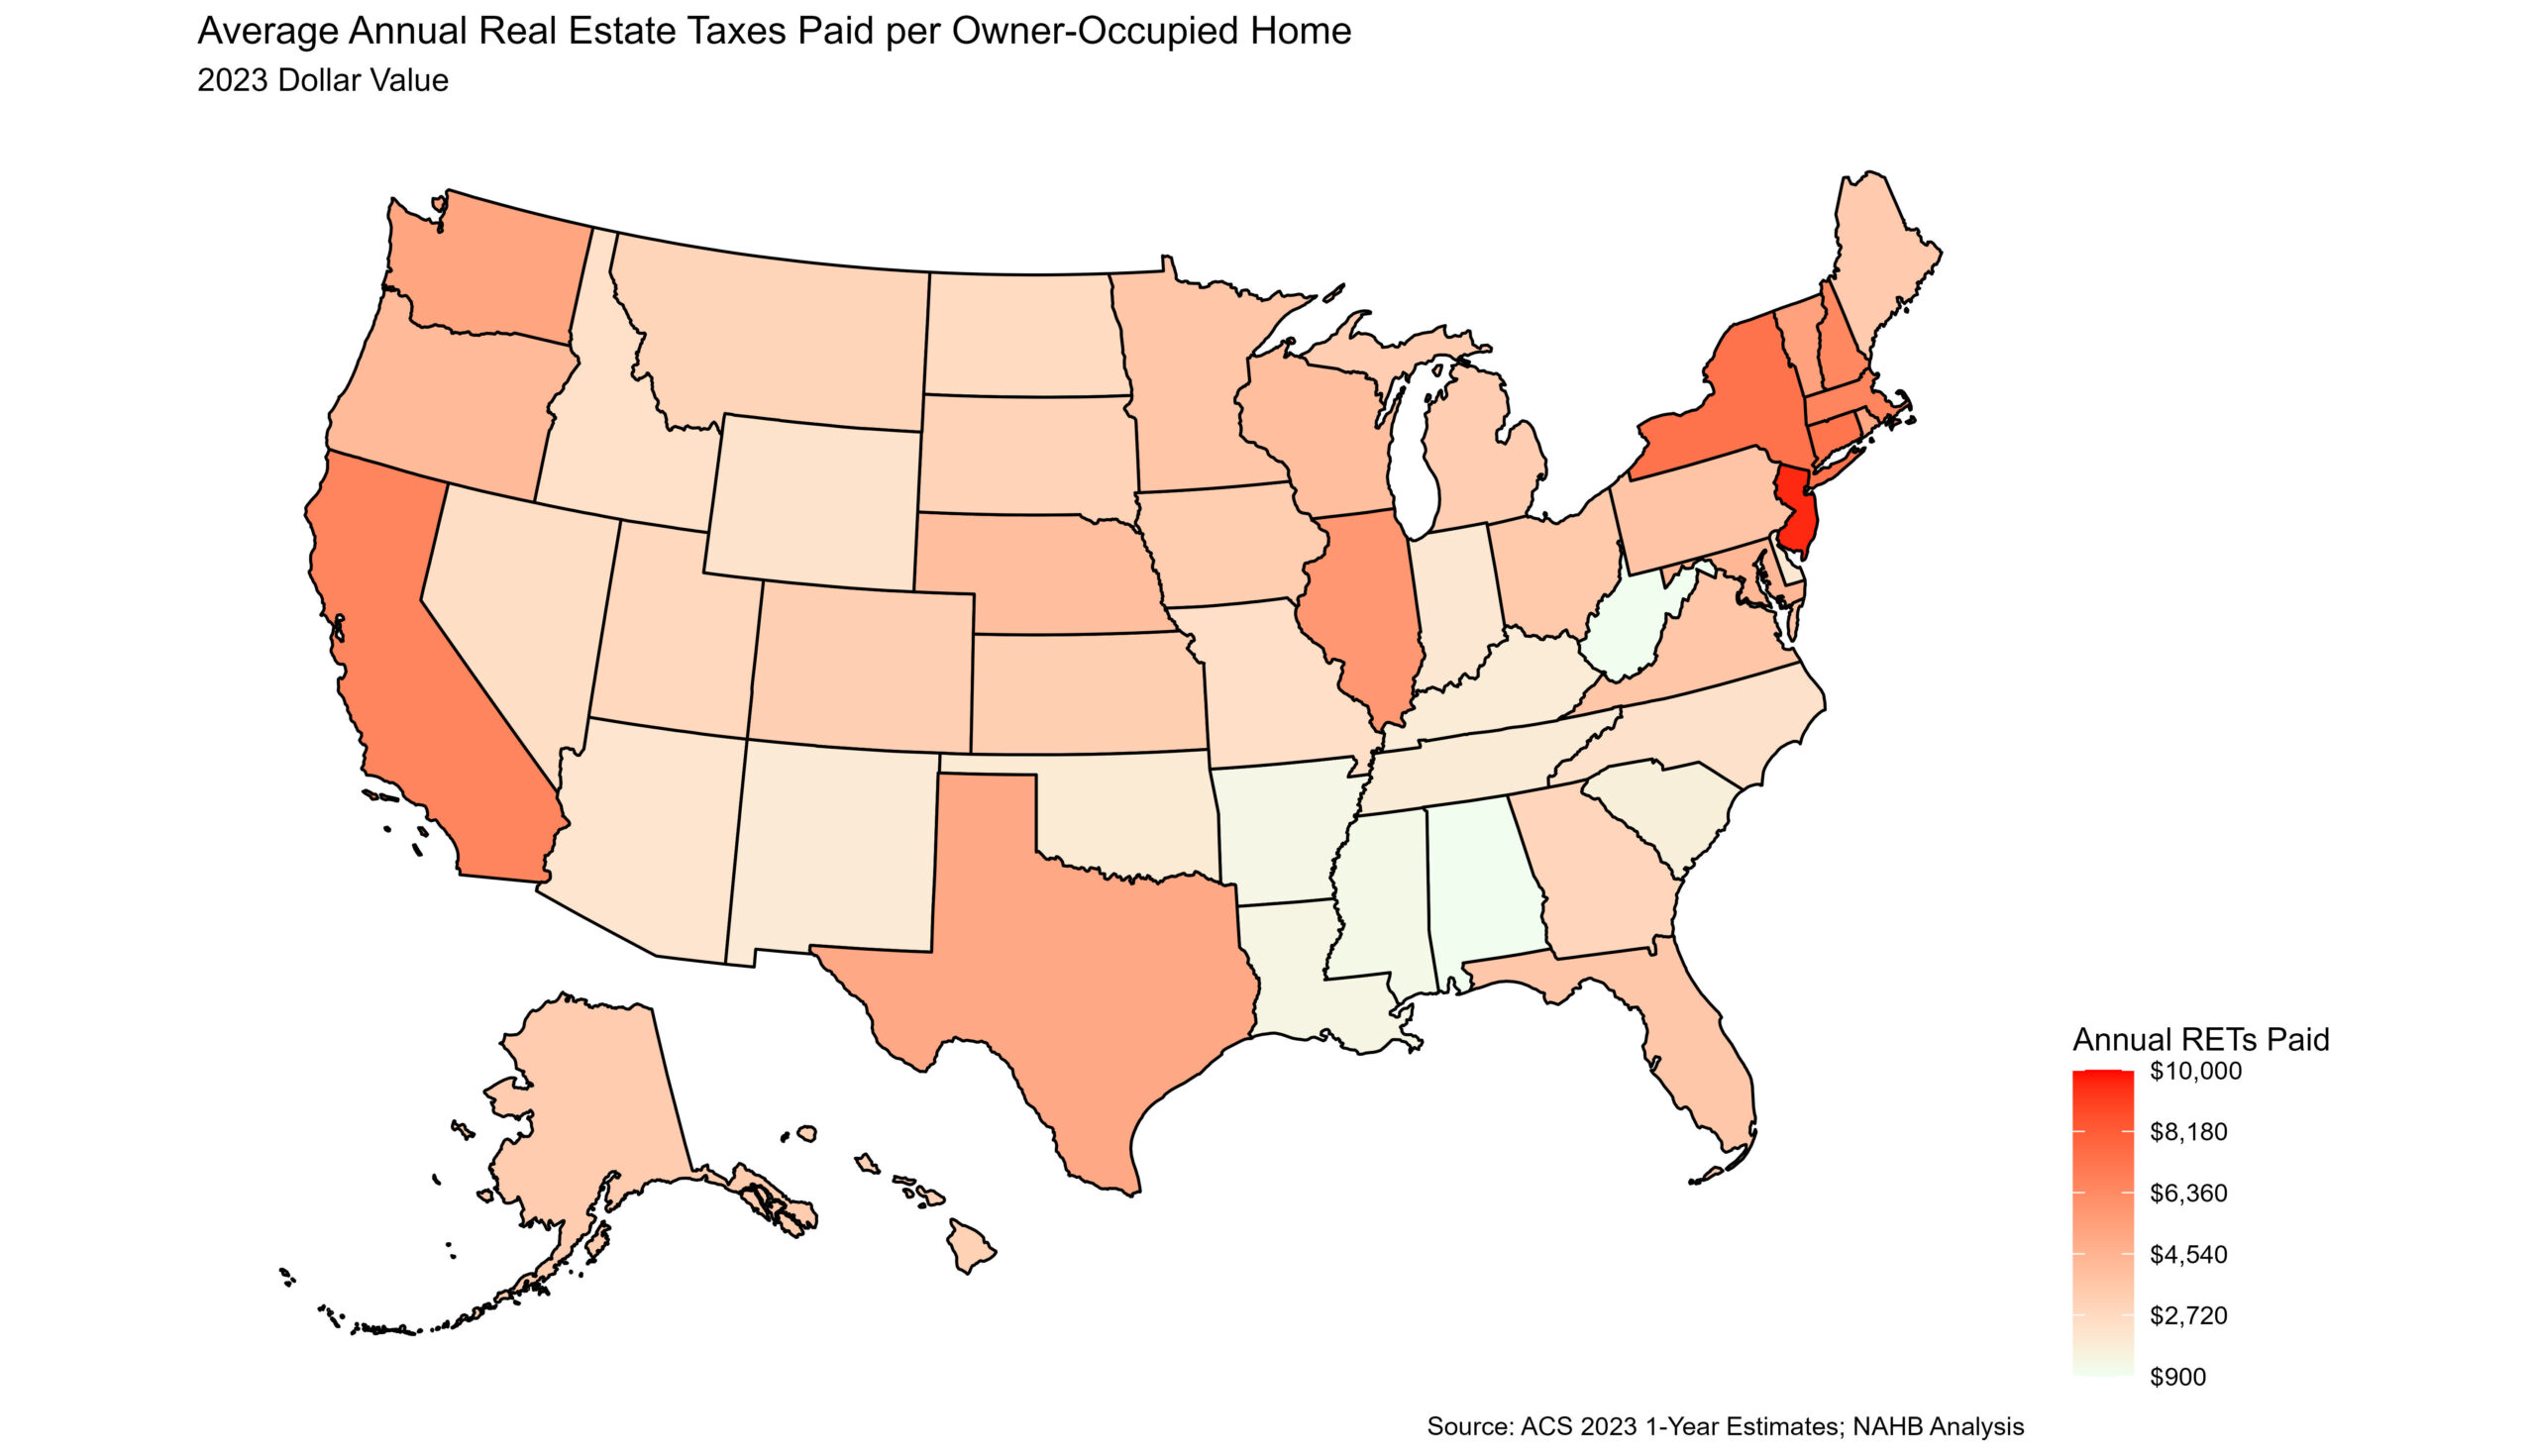
Nationally, across the 86 million owner-occupied homes in the U.S., the average annual real estate taxes paid in 2023 was $4,112, according to NAHB analysis of the 2023 American Community Survey. Homeowners in New Jersey continued to pay the highest real estate taxes, paying an average of $9,572, 30.6% higher than the second highest, New York, at $7,329 . On the other end of the distribution, homeowners in Alabama paid the lowest average amount of real estate taxes at $978. The map below shows the geographic variation of average annual real estate taxes (RETs) paid.

Compared to 2022, every state saw increases in the average amount of real estate taxes paid. The largest percentage increase was in Hawaii, up 21.1% from $2,541 to $3,078. The smallest increase was in New Hampshire, up 1.1% from $6,385 to $6,453.
Average Effective Property Tax Rates
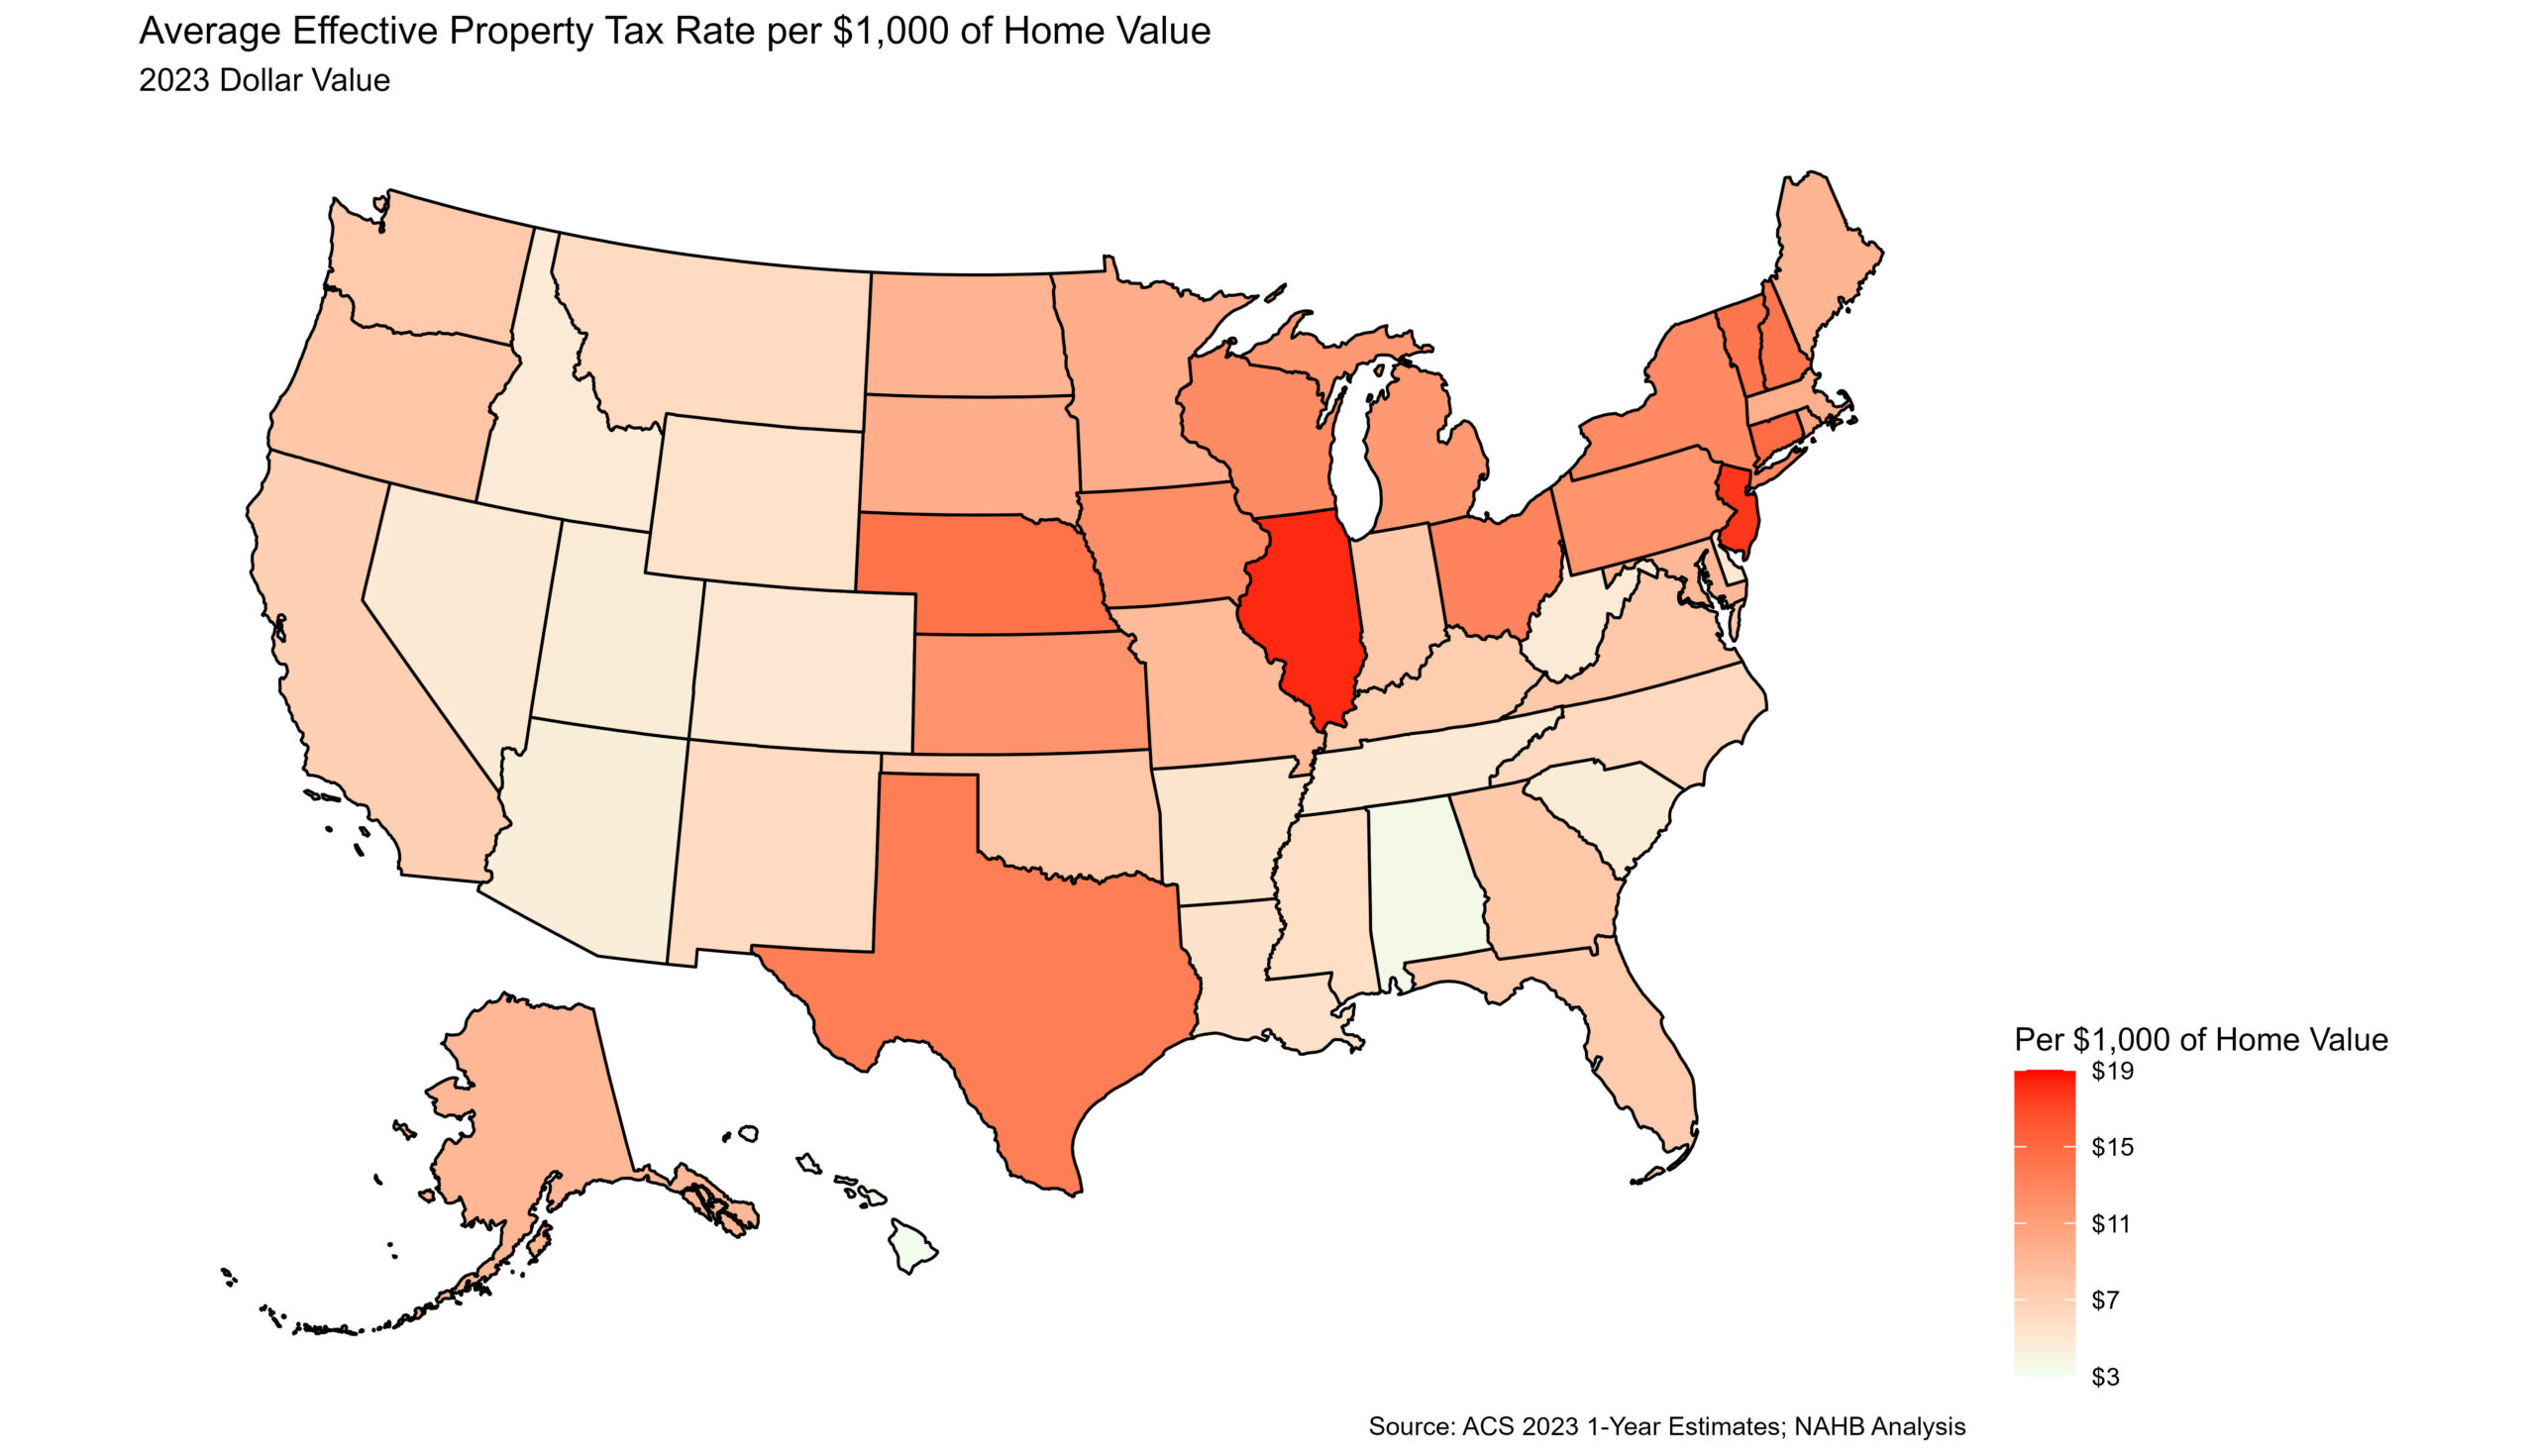
While average annual real estate taxes paid is important, it provides an incomplete picture. Property values vary across states, which explains some, if not most, of the variation across the nation in average annual real estate taxes. To control for property values and create a more informative state-by-state analysis, NAHB calculates the average effective property tax rate by dividing aggregate real estate taxes paid by aggregate value of owner-occupied housing within each state. For example, the aggregate real estate taxes paid across the U.S. was $352.3 billion with an aggregate value of owner-occupied real estate totaling $38.8 trillion in 2023. Using these two amounts, the average effective property tax rate nationally was $9.09 ($352.3 billion/$38.8 trillion) per $1,000 in home value. This effective rate can be expressed as a percentage of home value or as a dollar amount taxed per $1,000 of a home’s value. The map below displays the effective rate by state below.

Illinois, a change from New Jersey in 2022 , had the highest effective property tax rate at $18.25 per $1,000 of home value. Consistent with 2022, Hawaii had the lowest effective property tax rate at $3.18 per $1,000 of home value. Additionally, Hawaii had the largest increase over the year, up 18.8% from $2.68 in 2022. Twenty states saw their effective property tax rates fall between 2022 and 2023, with the largest decrease occurring in West Virginia where it fell 6.0%, from $5.06 to $4.75 per $1,000.
Intrastate Variation: Examples from New York
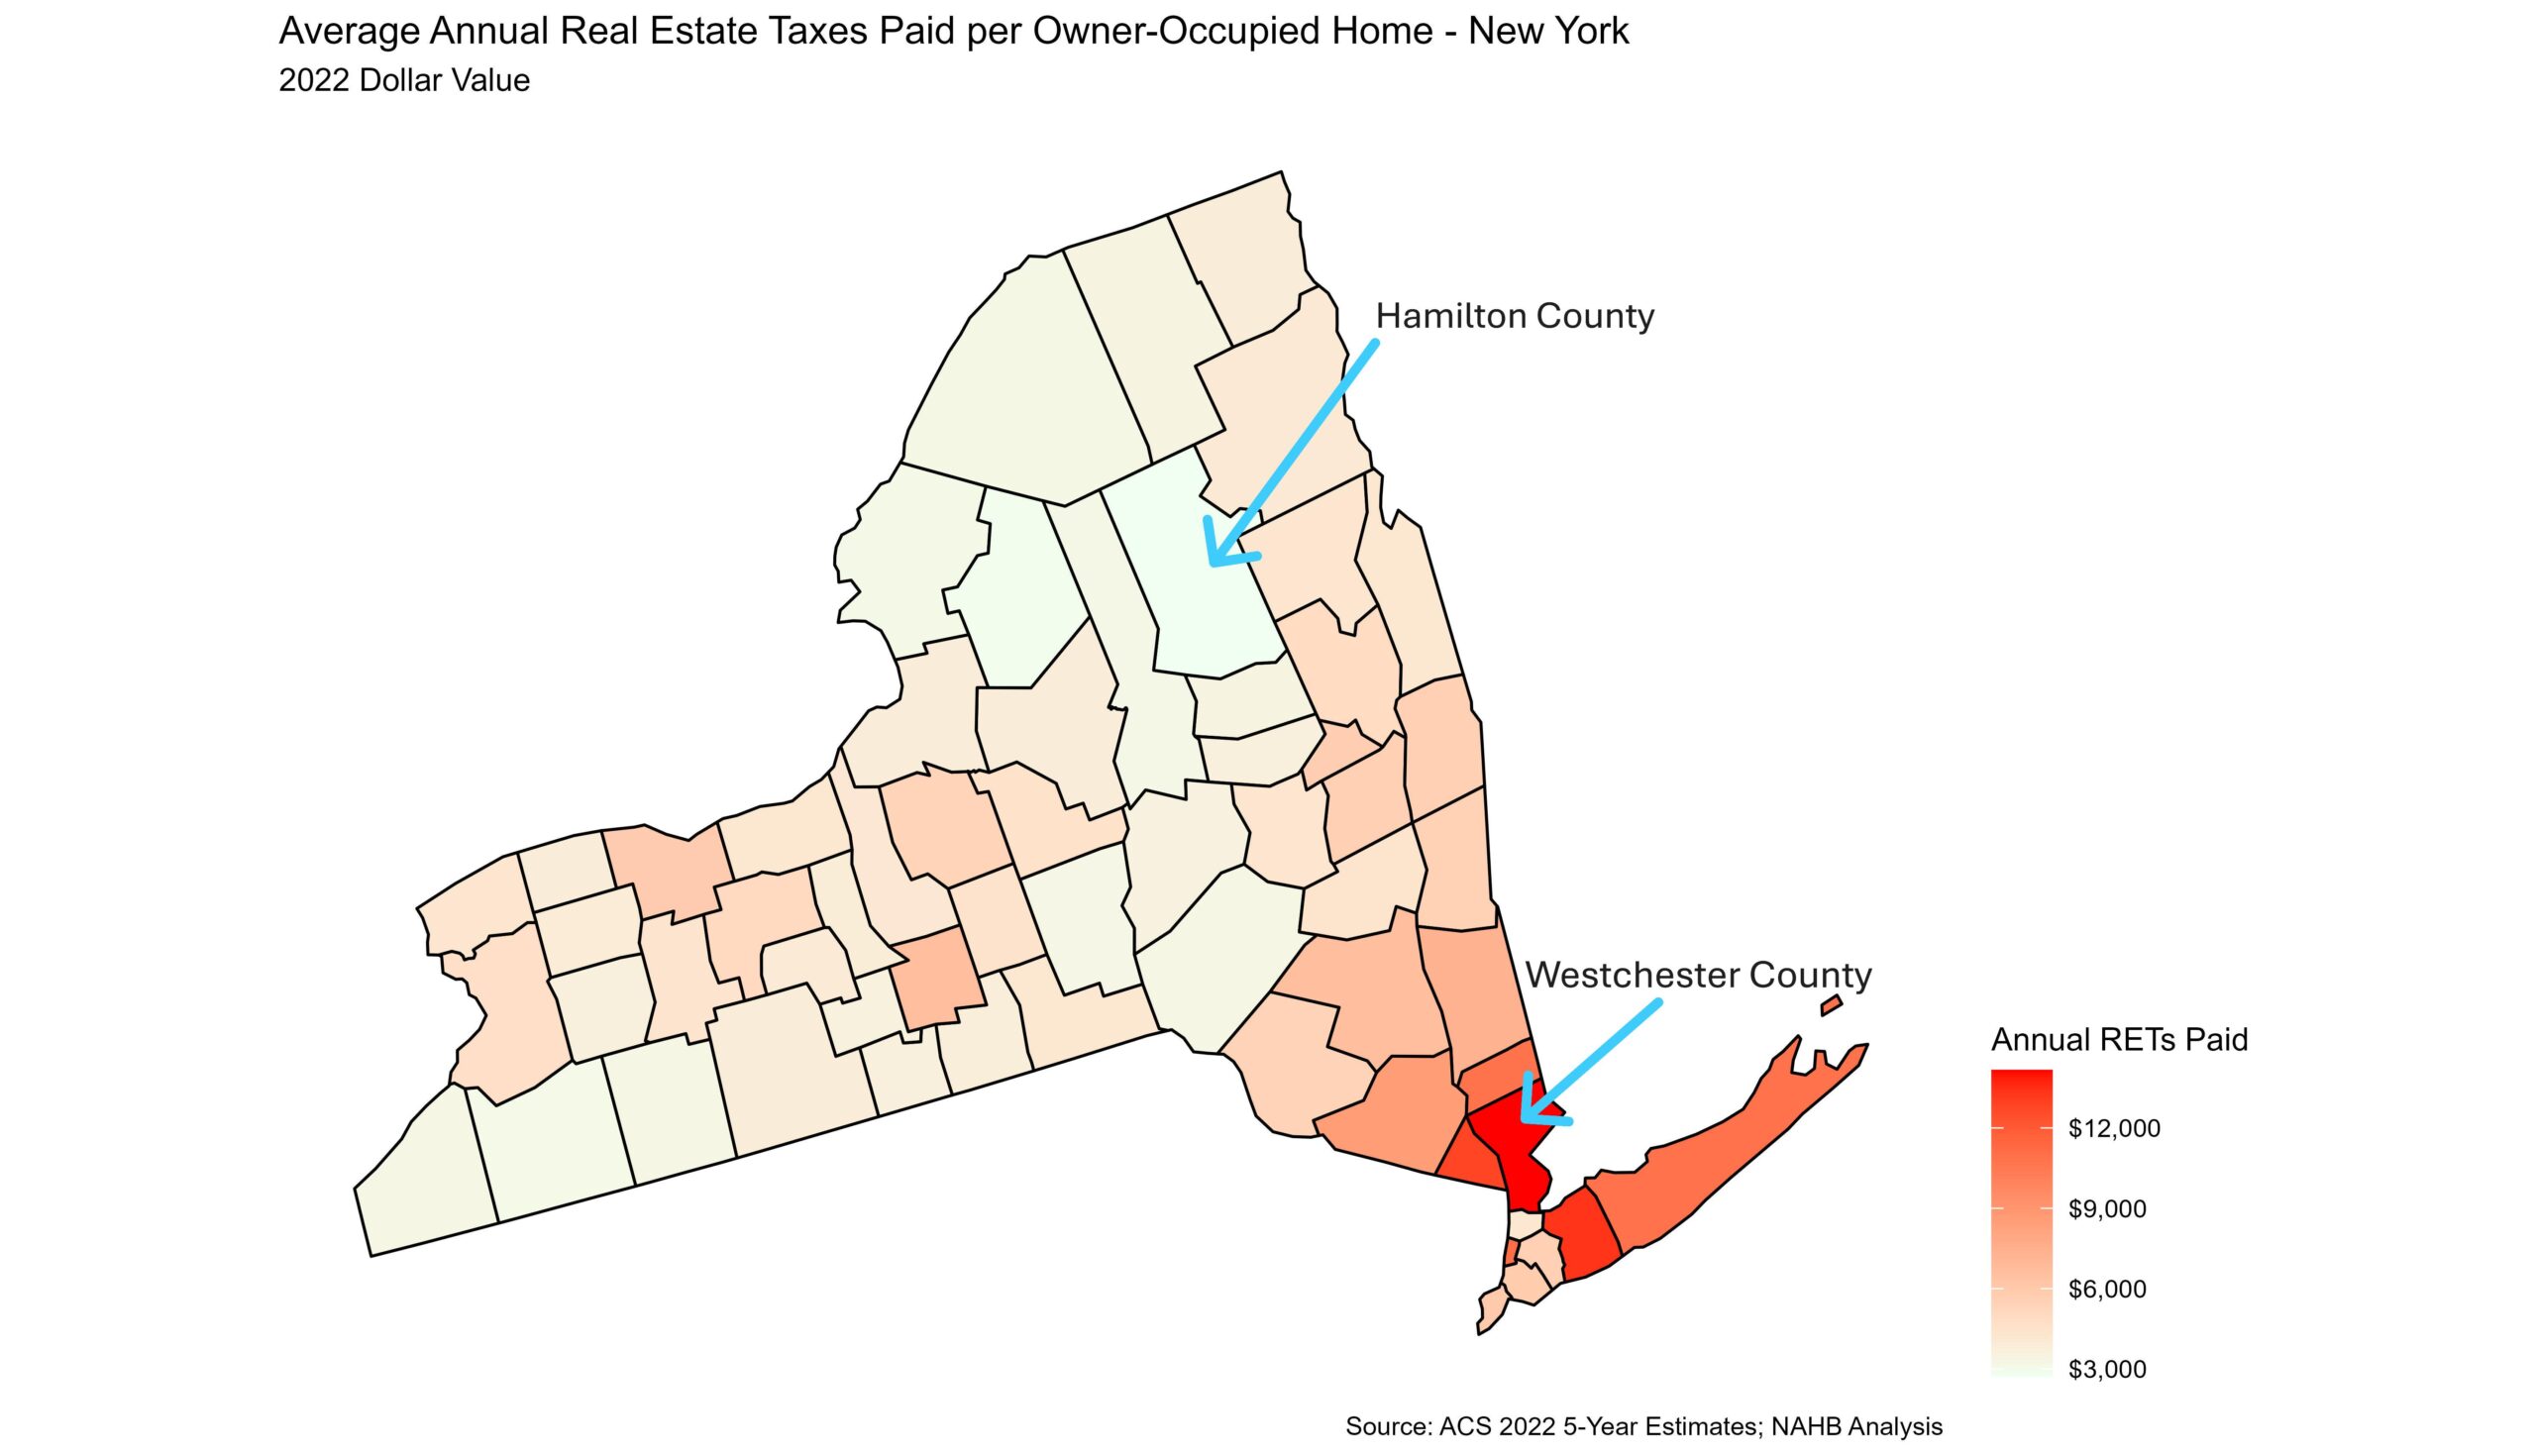
While property taxes clearly vary by state, there also exists variation within states themselves. The latest county level data available comes from 2022 5-year ACS estimates. Analyzing these data , New York showed the highest degree of variation of average property taxes paid and effective real estate tax rates across the counties of any state. Home owners in Westchester County on average paid $14,156 in real estate taxes in 2022, the highest of any county in New York. The lowest amount was in Hamilton County, where home owners paid on average $2,827 in real estate taxes.

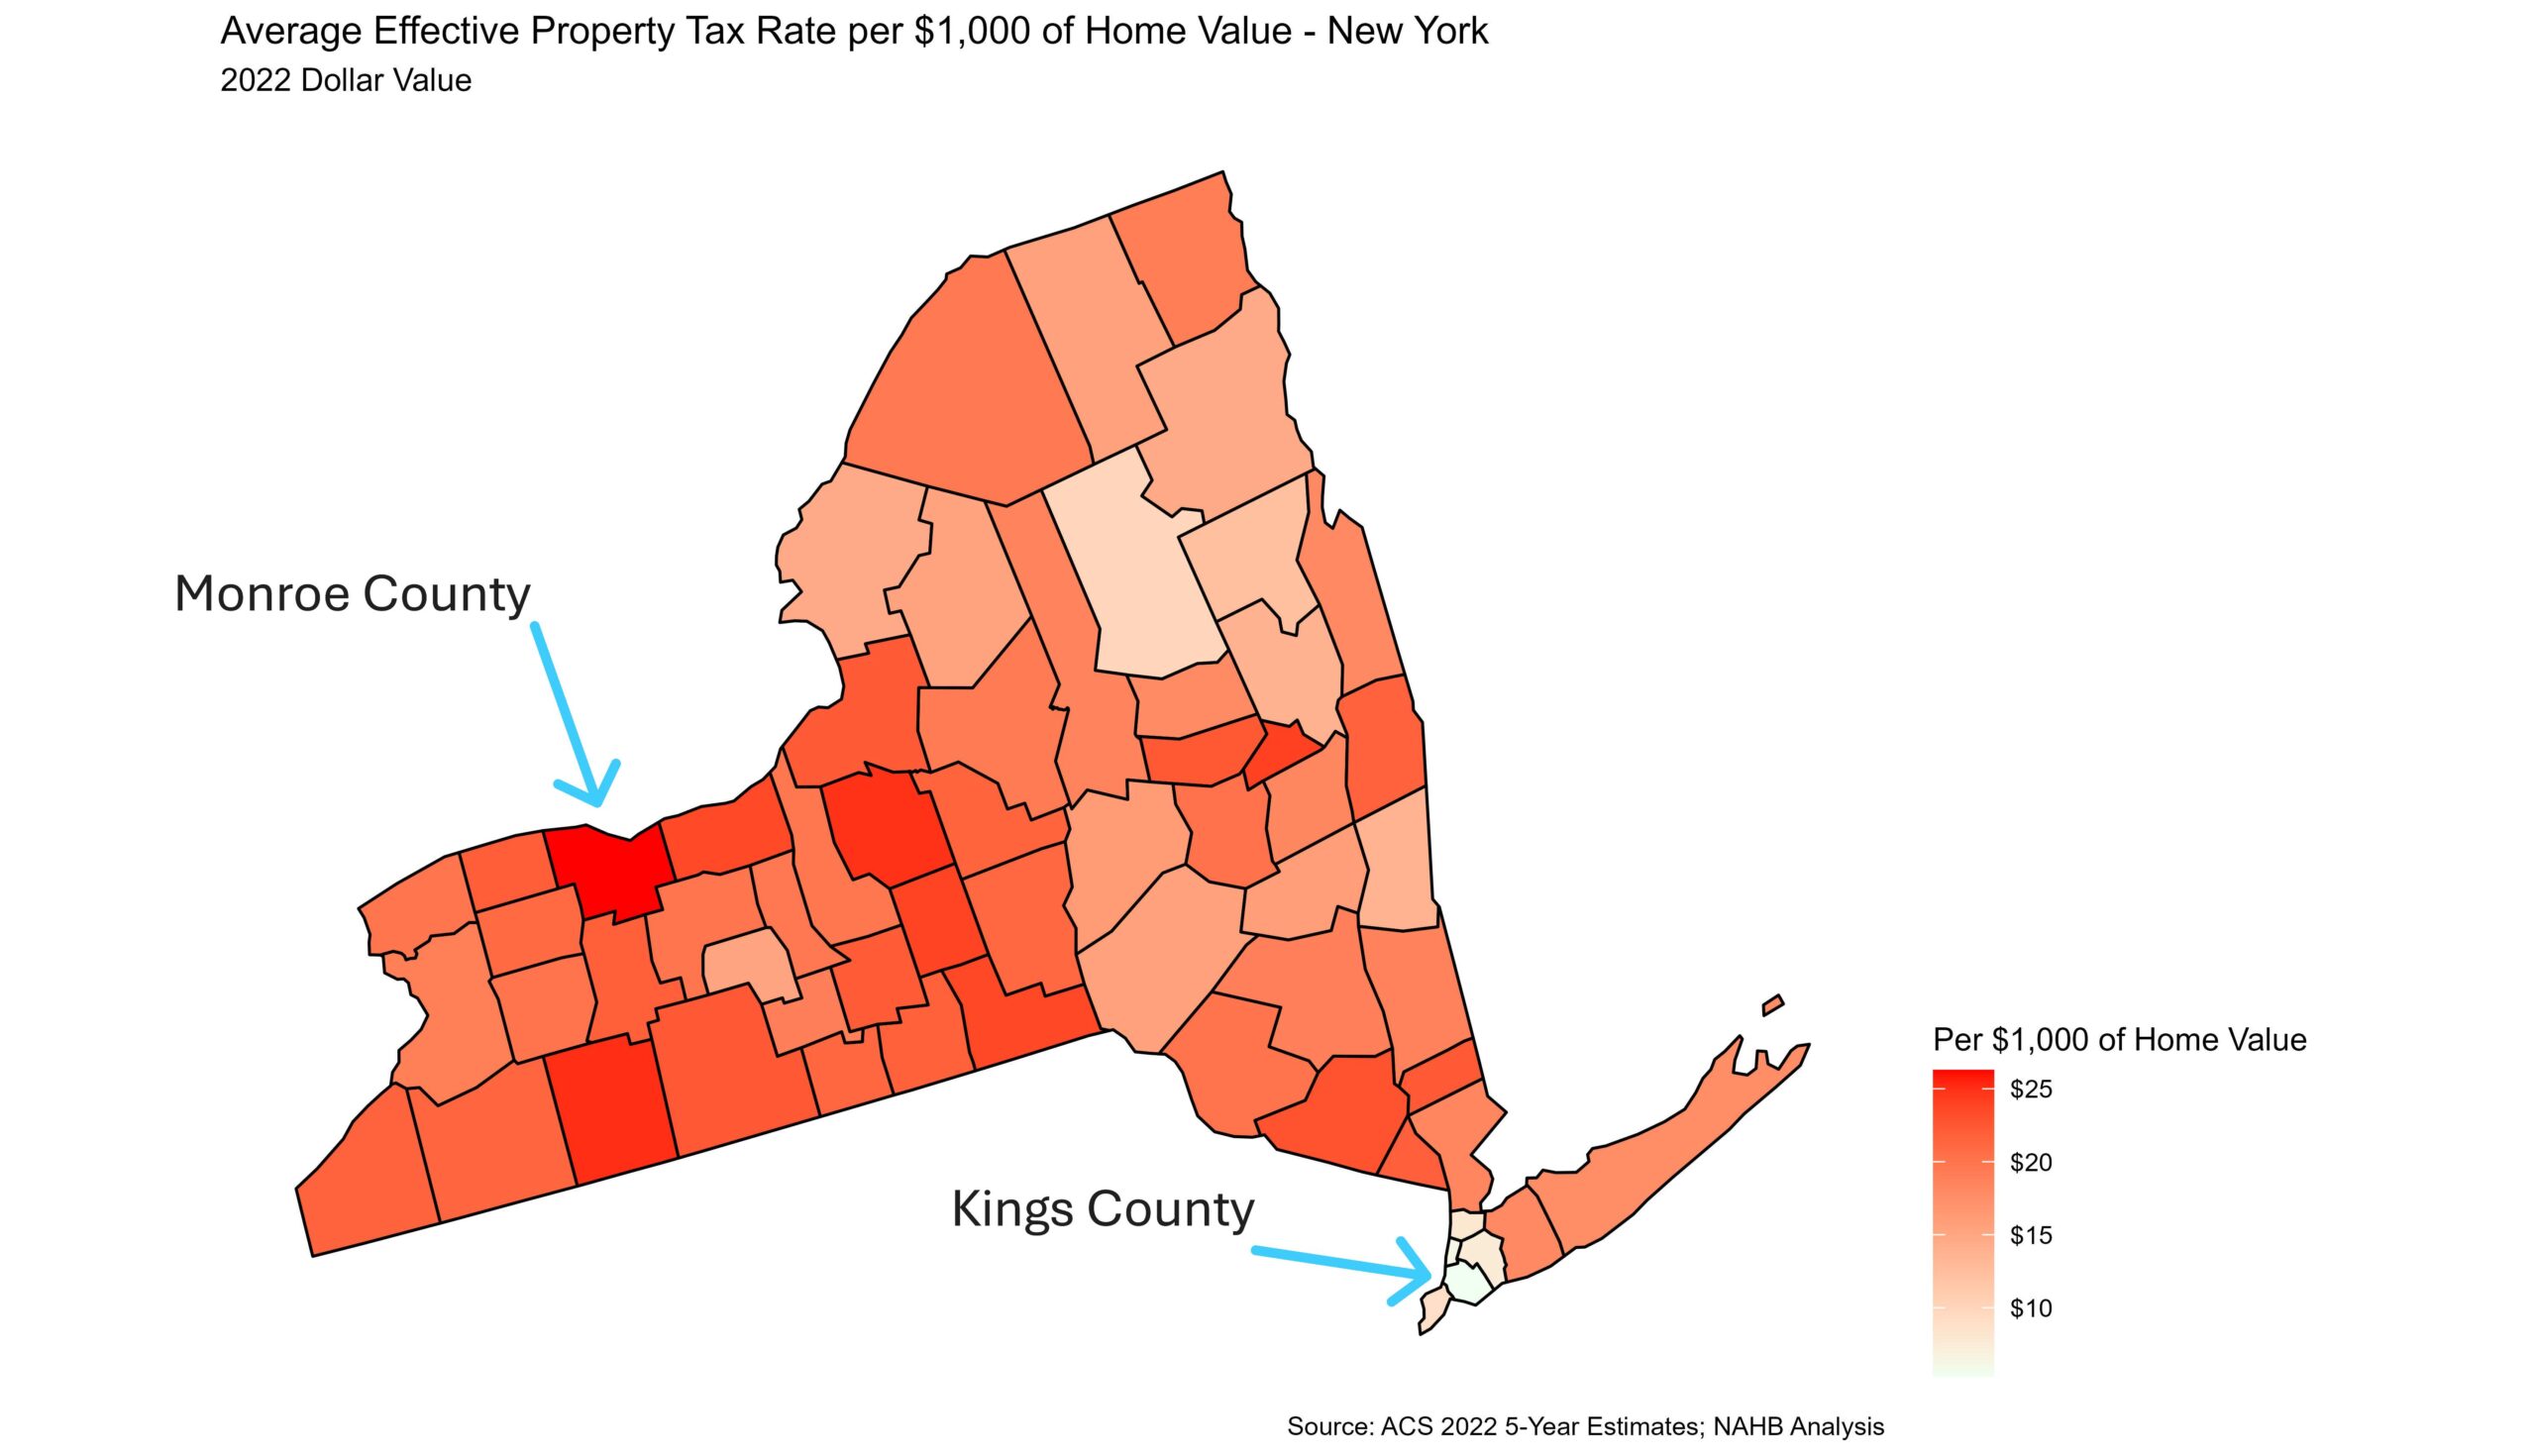
For effective property tax rates, New York continues to tell the story of intrastate variation. As shown above, Westchester County paid the higher average annual real estate taxes in 2022, but looking at effective property tax rate, which accounts for home value, Westchester’s effective property tax rate is near the middle at $18.34. Home owners in Monroe County seem to get the short end of the stick, paying at a rate of $26.27 per $1,000 of home value, the highest in New York. The lowest effective property tax rate was in Kings County, paying a mere $5.30 per $1,000 of home value in taxes.

Discover more from Eye On Housing
Subscribe to get the latest posts sent to your email.

Property tax should be per square foot rather than the value of the home. It is a wealth tax.
Empty and blighted land sits idle and ugly in cities. Cheaper to hold decayed land than to invest in it. So we now have a shortage of land for homes, and an excess of old ugly buildings.
IF the property tax were averaged by square foot over a zip code so that all land paid evenly then the owners of the blighted land could not afford to hold it empty.
Square foot of land or square foot of improvements (ie residence/garage/workshop/patios/decks)? Or a combination thereof? Its a complex calculation, any way you look at it. And land values, at least in Virginia, are already calculated based upon local values on a per sq foot basis – with allowances for things like type of access, type of surface/ground, etc. Improvement values could also be argued to say that they are also driven by square footage. The larger the house, the more taxes you will pay – in Virginia.
But what about the old and crumbling 3500 sq ft house that is too expensive to renovate and is ready to be bull-dozed? How do you tax that house compared to a 2000 sq ft house which was just built?
It is a hot topic – and very complicated.
Values are the easy way out and the lowest common denominator in the discussion. They are easy to define and there is a third-party database (the MLS system), not influenced by local politicians, that can be used to compare one property to the next and the values generated vary with the economy. I agree that improvements could be made to the system. However, throwing out the baby with the bathwater is shortsighted.