Home building in the 2010s was a story of the Long Recovery. After the Great Recession, the number of home builders declined significantly, and housing production was unable to meet buyer demand. This deficit of housing in the United States continues to exist because of persistent supply-side headwinds for builders, creating a critical housing affordability challenge for renters and homebuyers. Yet despite these challenges, residential construction is set to evolve and expand throughout the decade ahead.
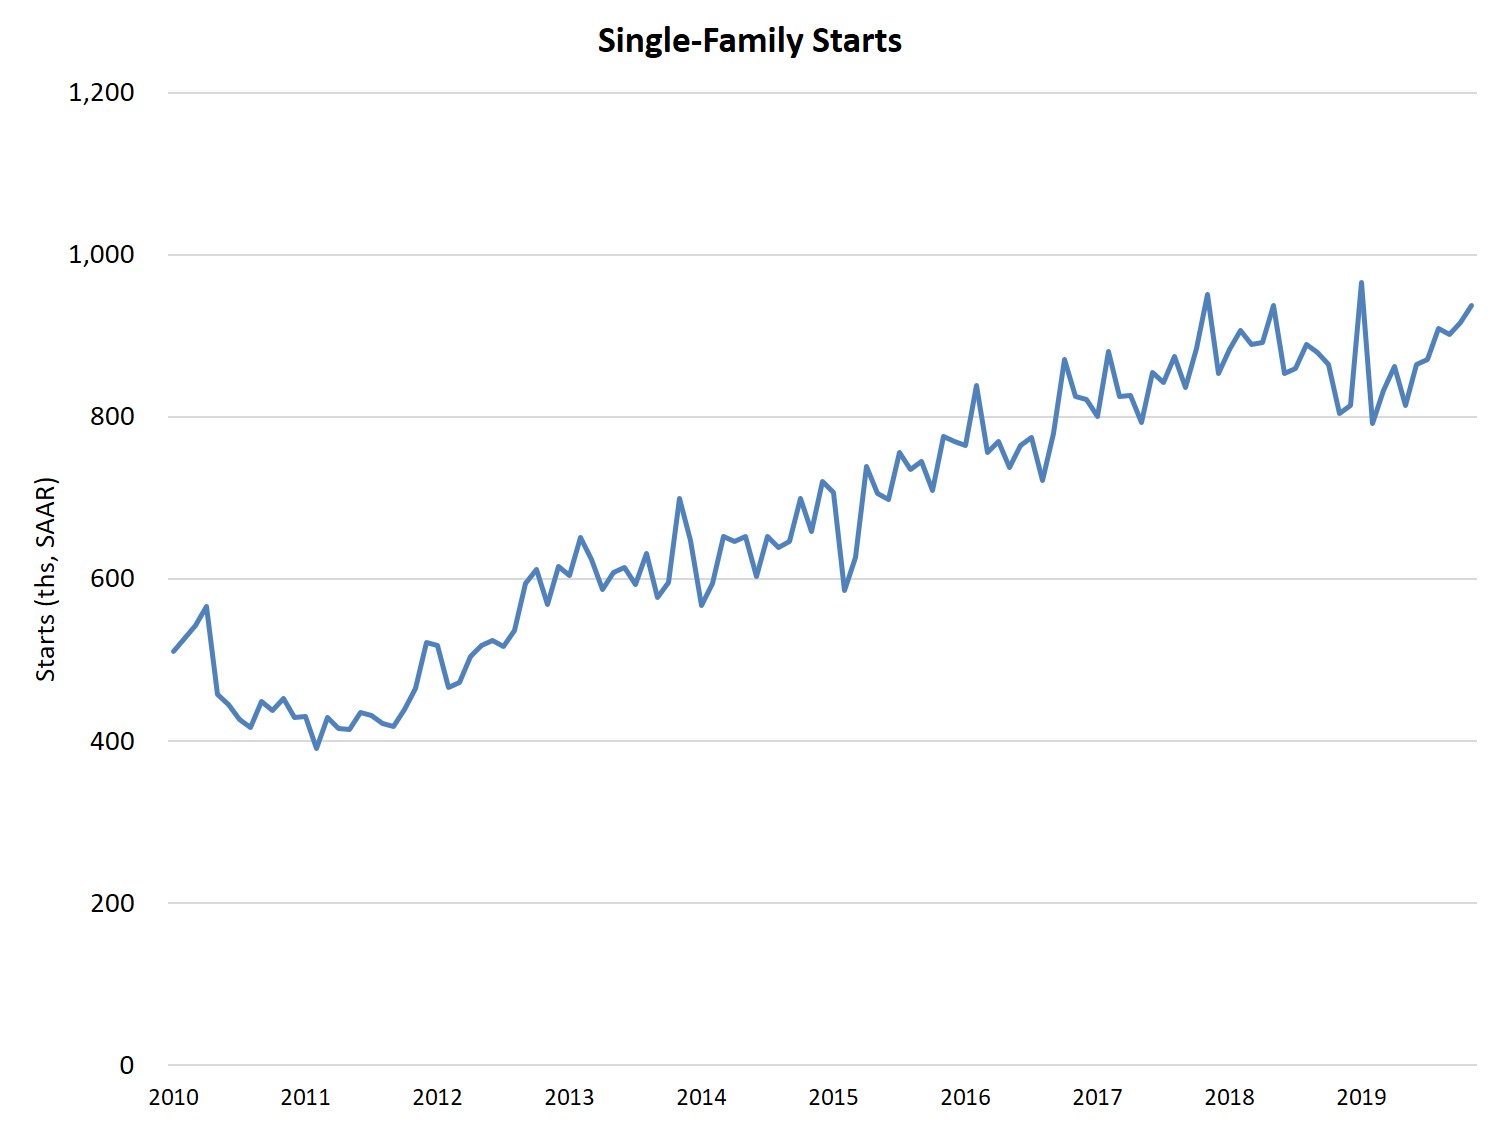
Between 2010 and the end of 2019, there were 6.8 million single-family housing starts.
That total included:
- 1.53 million custom home building starts
- 827,000 townhouses starts (single-family attached)
- 300,000 single-family built-for-rent (SFBFR) starts
More than half (54%) of single-family starts occurred in the South region, and nearly a quarter (23%) were in the West. The Midwest and Northeast regions accounted for 15% and 8% of starts, respectively. Overall, single-family starts have grown modestly over the past decade. However, that expansion was curbed by occasional soft patches, the first occurring in mid-2010 with the cessation of the stimulus era homebuyer tax credit
Multifamily starts during the 2010s totaled 3.1 million. Most (2.98 million) were built in properties of five or more units, while just 123,000 were in 2- to 4-unit buildings. Only 7% (229,000) were built-for-sale condos, compared to a historical average share of 20%. The overall multifamily building sector peaked in 2015 and then leveled off in succeeding years.

Remodeling activity expanded in the 2010s, though it slowed in recent months with the declines in existing home sales. Approximately 150 million home remodeling projects occurred during the decade. Total spending on improvements made by remodelers to existing, owner-occupied homes eclipsed $1.5 trillion.
The home building declines of the Great Recession had a large impact on the industry’s labor force. The sector suffered a net loss of 1.5 million jobs between 2005 and 2010. After reaching a low point in 2011, employment in the industry has slowly increased with nearly 940,000 net jobs, further illustrating what the housing industry means to the U.S. economy.
In terms of overall economic impact, the home building component of Gross Domestic Product, residential fixed investment (RFI), totaled 3% of GDP over the last decade. This share accounted for approximately $5 trillion of economic activity from 2010 through the end of 2019.
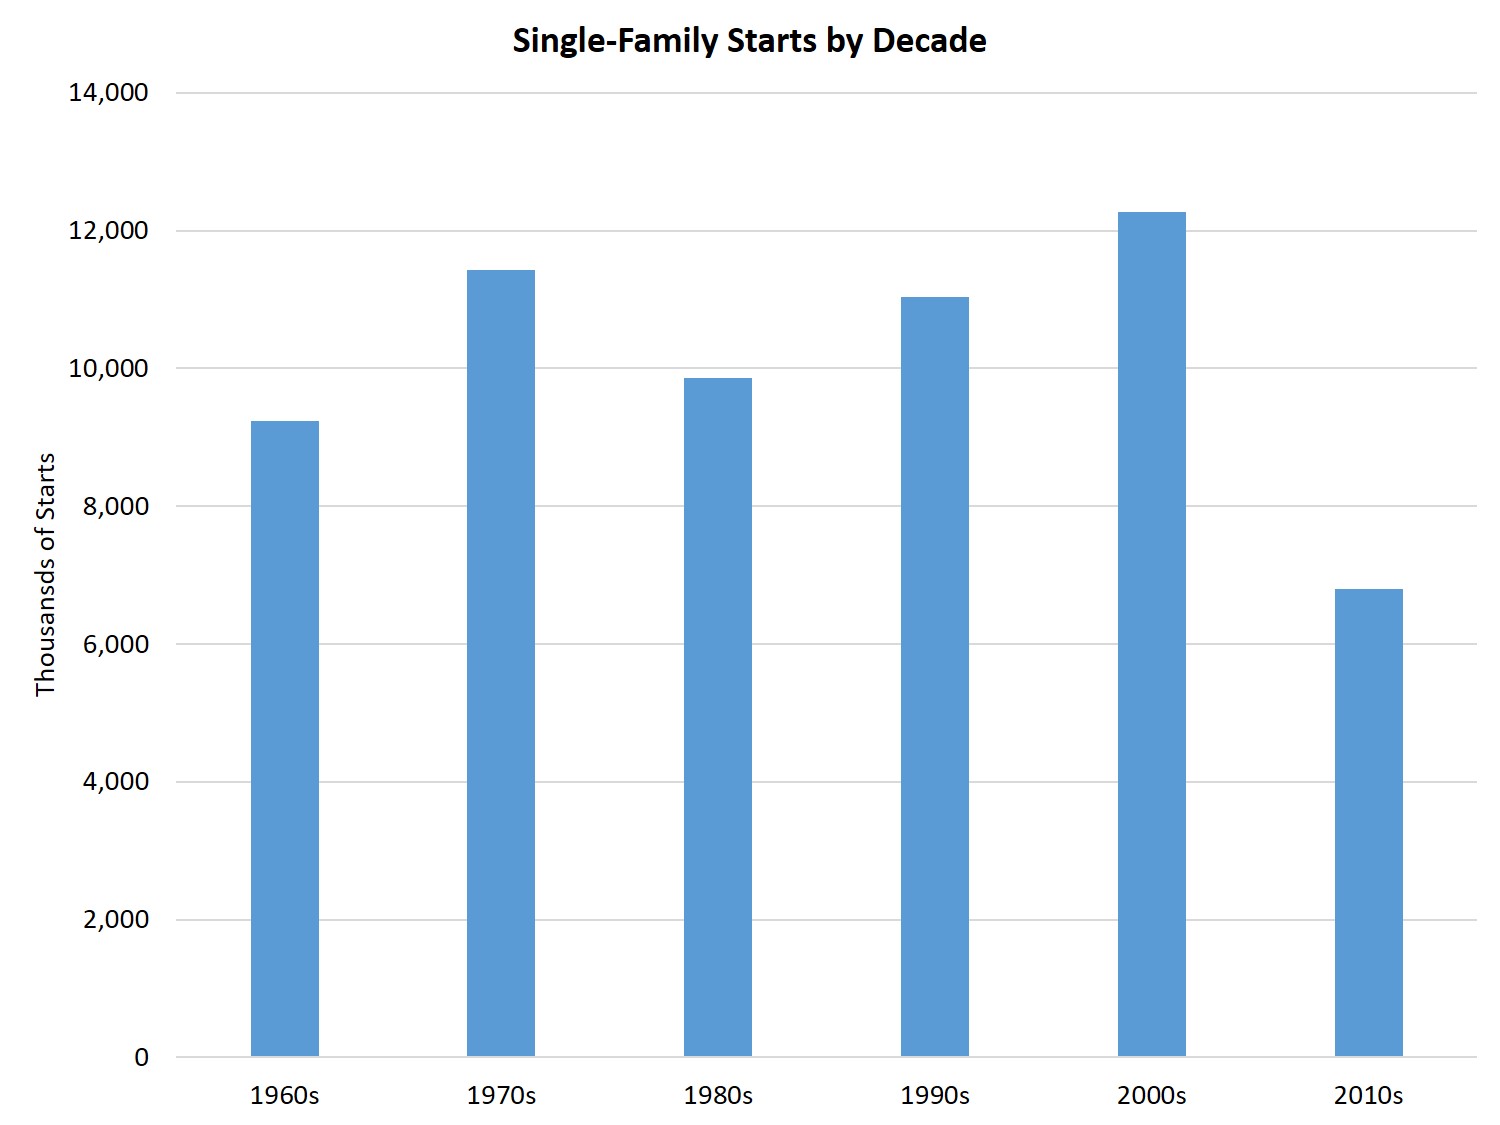
Despite these large economic impacts, the last ten years have seen significant amounts of underbuilding compared to prior decades. Consider the following decade-based totals for single-family home construction:
1960s: 9.3 million starts
1970s: 11.4 million starts
1980s: 9.9 million starts
1990s: 11.0 million starts
2000s: 12.3 million starts
2010s: 6.8 million starts
The reduced amount of single-family home construction over the last decade is even more striking when considering the U.S. population has continued to increase over time. For example, here are the production numbers as measured in terms of starts per million population (averaged over the decade).
1960s: 47,997 starts
1970s: 53,138 starts
1980s: 41,588 starts
1990s: 41,710 starts
2000s: 41,671 starts
2010s: 21,288 starts
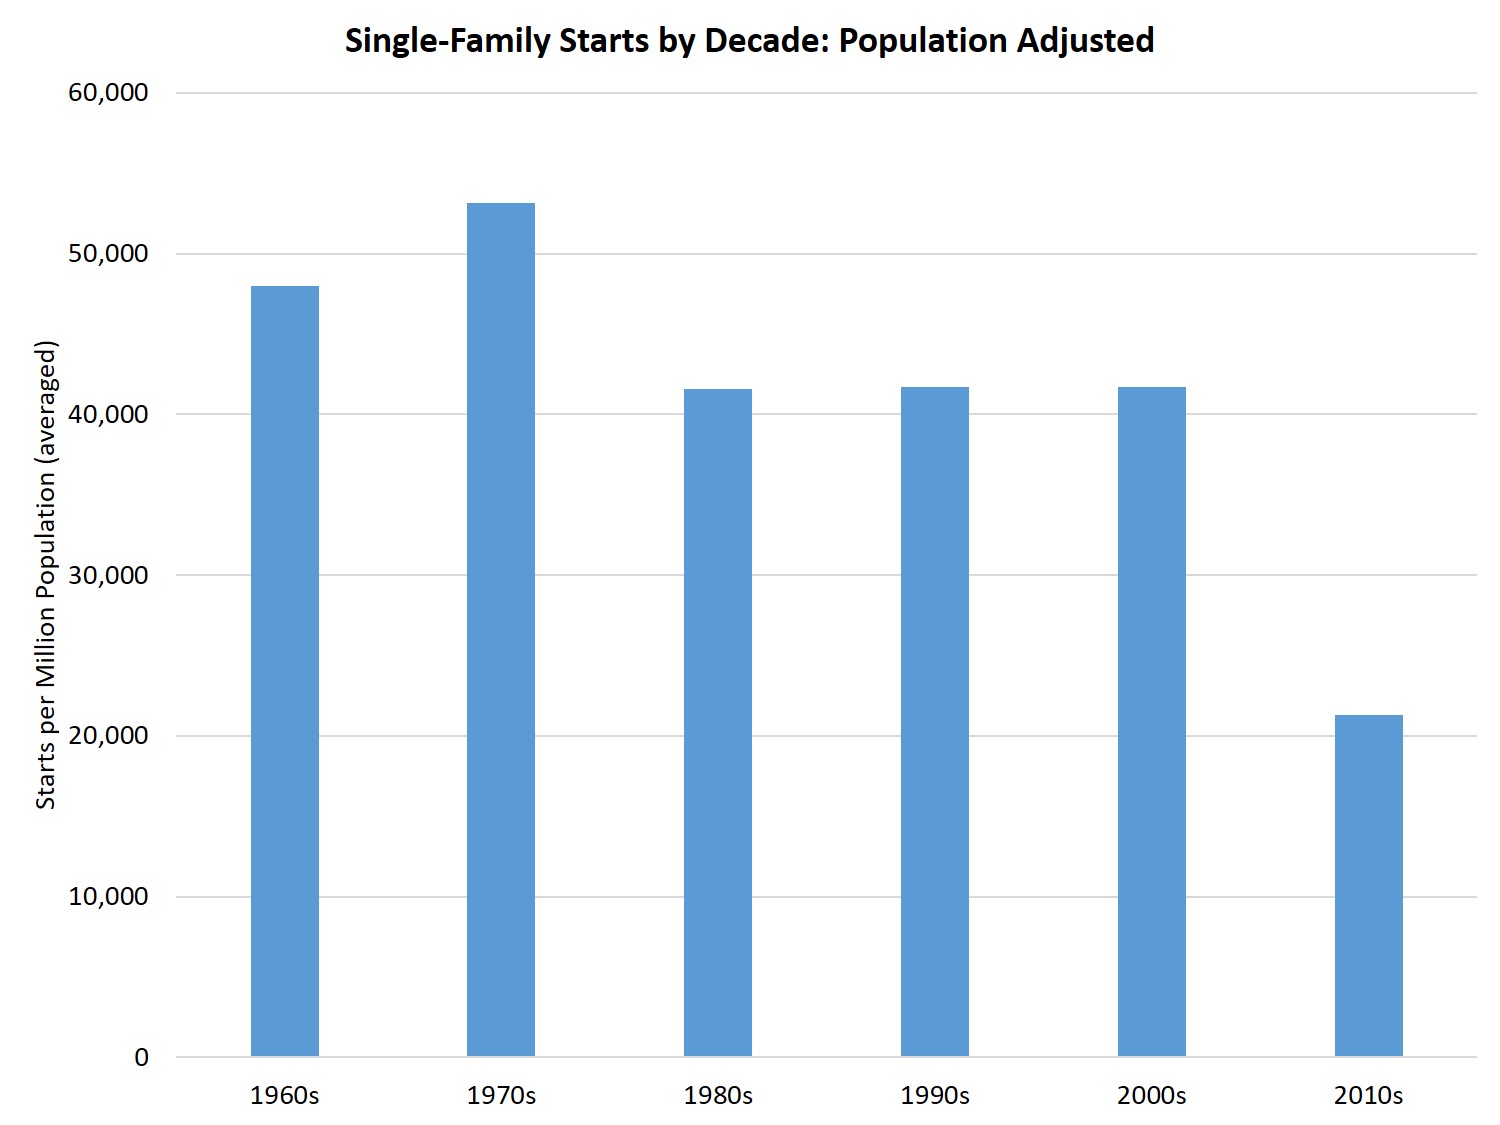
After a downshift following the Baby Boomer induced single-family home construction wave of the 1970s, the population-adjusted pace of single-family construction was remarkably constant, despite year-to-year ebbs and flows. In fact, over the period of 1980 through the end of the 2000s, single-family construction averaged just higher than 41,000 starts per million of population. The 2010s stand out as the exception to this general benchmark, with single-family construction operating near 50% of this pace following the demand-side and supply-side impacts of the Great Recession.
Why Were the 2010s Different?
It is tempting to attribute the relative construction weakness over the last decade to purely demand-side variables, namely the residual uncertainty caused by the Great Recession and a falloff in demand due to the smaller size of Generation X. Clearly, reduced demand compared to decades past had an important role in holding back home building, particularly in the first half of the decade, but this occurred during a period of time of rapid price growth. The low levels of production also occurred with falling vacancy rates, declining housing affordability, and rising building costs. These supply-side headwinds held back home construction in the 2010s and resulted in a net housing deficit for the U.S.
Consider population growth over the last decade. The U.S population expanded by more than 20 million during the 2010s. While this represents a slower rate of growth than that of the 2000s (with a gain of more than 24 million), this increase still marks a solid level of demand for new home construction with a gain of approximately 10 million households.
End of Homeownership Declines
Despite the country’s ever-growing population, the momentum for housing demand was primarily within the rental market during the first half of the decade. The homeownership rate fell from 67.1% at the start of the decade to a post-recession low of 62.9% during the second quarter of 2016. As a result of this demand environment, multifamily construction was the first sector of the industry to recover to relatively normal conditions, which were achieved in construction terms by 2015.
During the second half of the decade, the homeownership rate rebounded to 64.8% by the third quarter of 2019. This is higher than many expected, as some analysts had forecasted the rate slipping below 60% due to national demographic changes and faltering demand for for-sale housing due to the Great Recession. However, consumer preference surveys from earlier in the decade showing homeownership remains a goal for most households suggested otherwise.
Interest Rates Impacts on Affordability
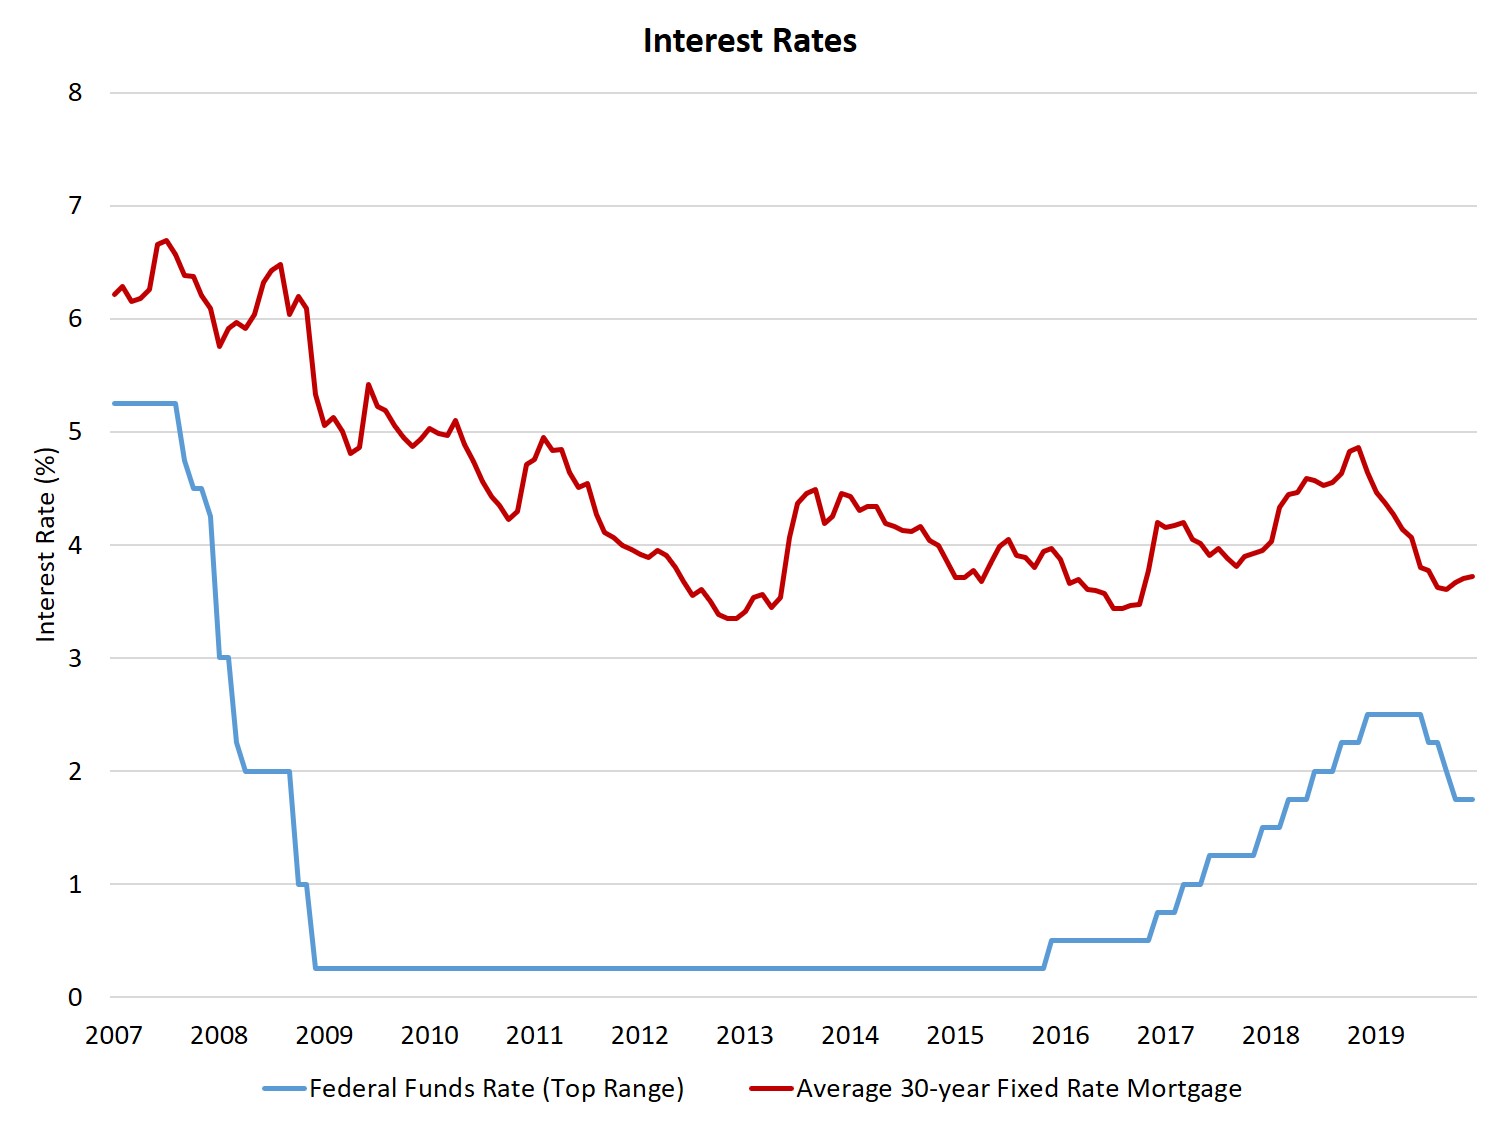
While the general preference for homeownership remains solid, the impact of housing cost is key. And the cost of buying a home depends on a number of factors, including interest rates. For much of the past decade, accommodative monetary policy supported low mortgage interest rates. For example, from late 2008 until late 2015, the Federal Reserve held the key federal funds rate near 0%. From 2012 until the passage of the tax reform law of 2017, mortgage rates remained near 4%. A notable rise in rates, which caused a soft patch for housing, occurred with the “taper tantrum” of 2013, as rates increased due to the announcement by the Fed that it would reduce the scale of bond purchases as a part of ending Quantitative Easing. The negative bond market reaction was a sign that financial markets were sensitive to monetary policy changes, an outcome that would repeat again in 2018.
The other notable period of interest rate increases occurred with the election of President Trump at the end of 2016 and the expectation of pro-growth regulatory policy, combined with the enactment of the 2017 tax reform bill and decidedly hawkish projections and actions from the Federal Reserve. There were eight 25 basis point increases in the federal funds rate from the start of 2016 until the fall of 2018. A number of economic variables indicated that this rapid tightening in rates was a policy mistake, including a large decline in the NAHB/Wells Fargo HMI at the end of 2018, as well as the following stock market sell-off at the end of that year.
Fortunately, the Fed reversed course and cut rates three times in 2019, and signals strongly indicate the Fed is now on pause. This financial setting leaves rates averaging around 3.7% for the 30-year fixed rate mortgage. This is a considerably more favorable environment for housing with respect to rates compared to the end of 2018, when housing sales and construction softened. The Housing Affordability Crunch of 2018 has largely subsided as single-family construction rebounded in the second half of 2019.
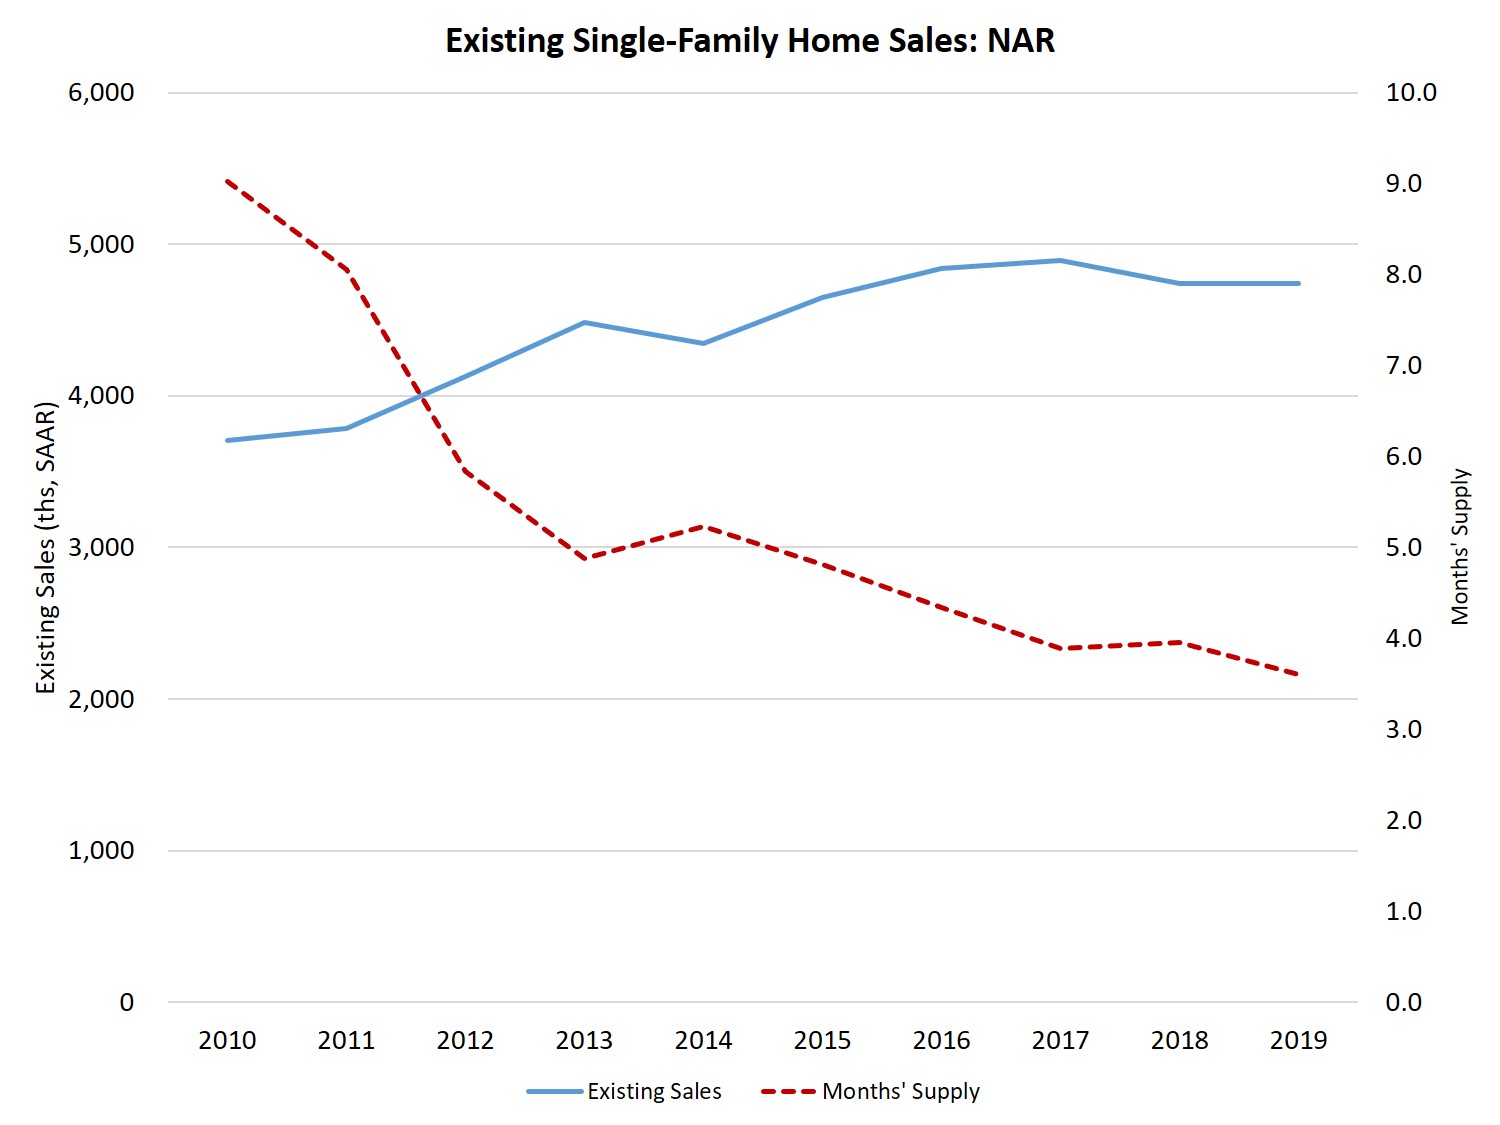
Years of population and household formation growth, combined with relatively reduced levels of home building, have left the market with a critical supply shortage. As estimated by the National Association of Realtors, existing home sales growth has lagged while inventory declined. In fact, as of November 2019, inventory has fallen to a 3.6-month supply, where a 6-month supply would represent a balanced market (although there are good arguments that the 6-month benchmark is somewhat too high in today’s marketplace).
Builder Optimism
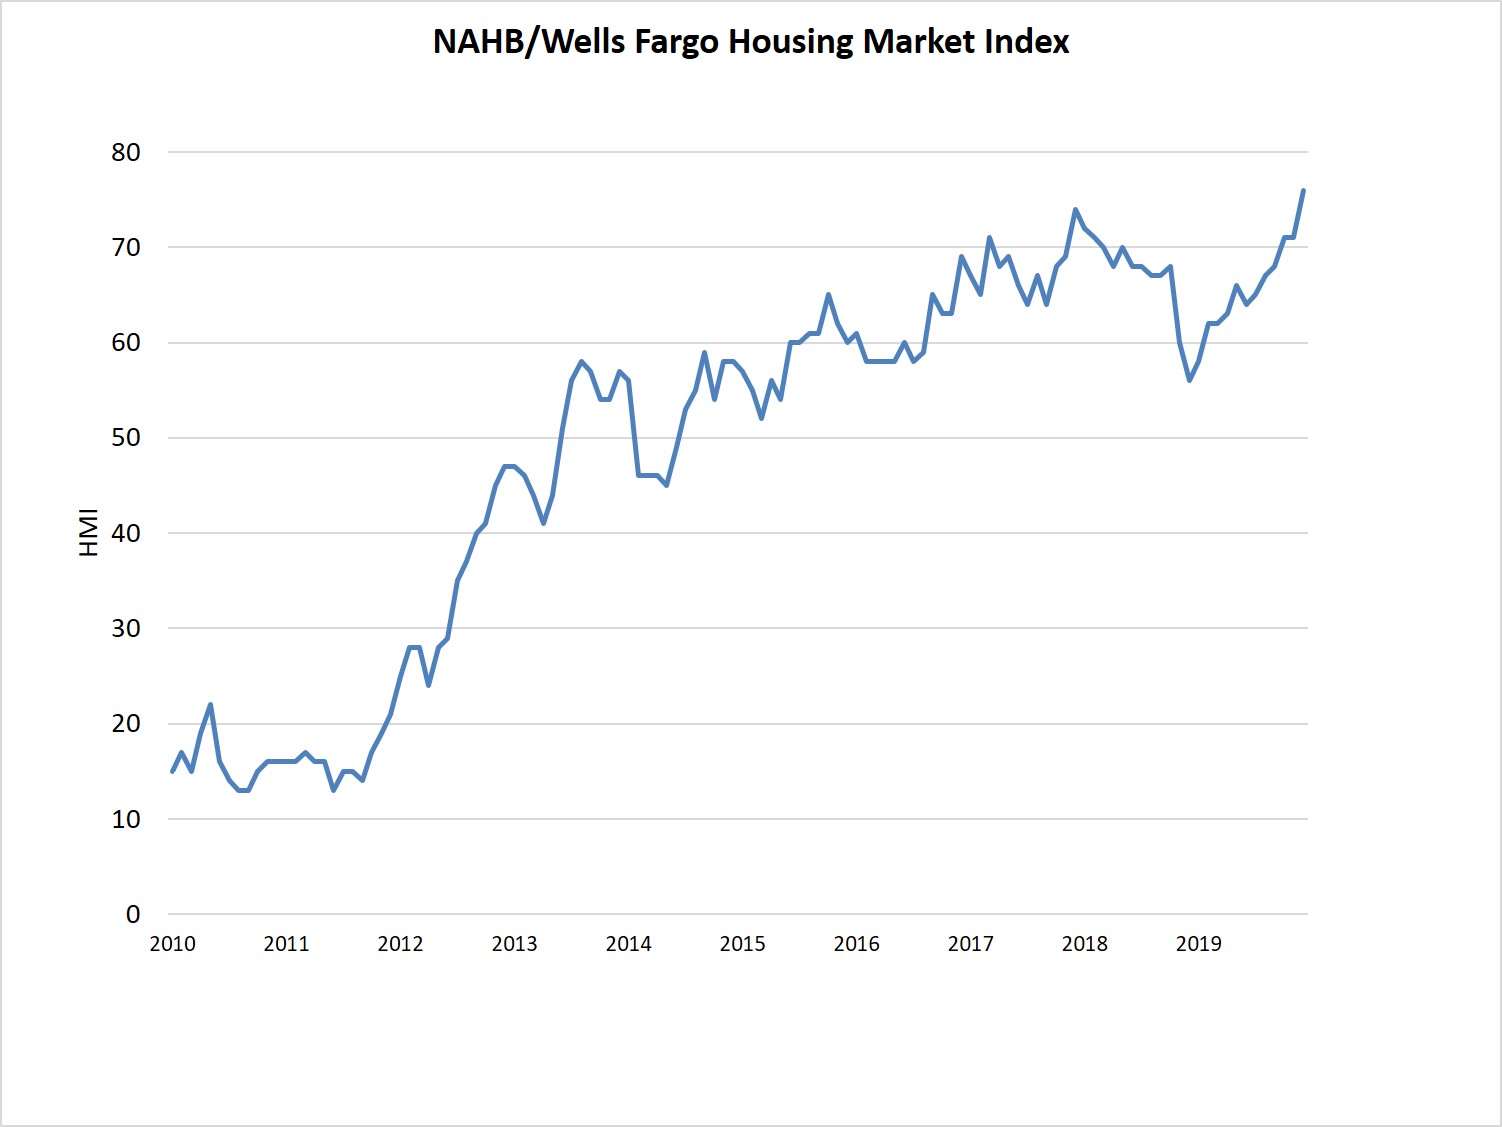
Low resale inventory and generally healthy economic conditions — including the longest economic expansion in American history — have lifted builder sentiment. Confidence increased to 25 at the start of 2012, as the post-stimulus era recovery for home building began.
By June of 2013, the HMI finally exceeded a level of 50, the first time since the Great Recession. In 2014, the HMI briefly fell below 50, as a result of the taper tantrum and housing soft patch of 2013-2014. After that slight decline, the HMI trended higher due to lack of market supply and declining interest rates. The HMI reached a level of 72 at the start of 2018.
As noted earlier, a challenging period occurred in late 2018, prior to the stock market declines at the end of the year, as the HMI fell from 69 in October to 56 in December. This was a clear sign that the Federal Reserve policy of higher rates, and the corresponding rising risk of a recession, was a concern for the building industry. But over the course of 2019, the HMI increased on lower rates, reduced macro concerns, and positive labor market conditions. In December, the index reached a level of 76, the highest reading since the summer of 1999.
Matters of Supply and Demand
The paradox of declining inventory, rising home prices, and underperforming single-family construction has been the most important home building research focus of the last decade. Traditional demand-side housing analyses are insufficient to explain these market conditions. The lack of building is rooted in a set of supply-side headwinds that limit home construction in expanding markets.
Since 2015, NAHB’s explanation and forecasts have referred to this complex set of limiting factors as the five Ls: lack of labor, lots/land, lumber/materials, lending for builders, and laws/regulatory burdens. No single factor alone can sufficiently explain the housing supply equation of the last decade. And to a certain degree, the challenges offered by this set of issues are rooted in consequences of the Great Recession on the structure, organization, and enforced policies on the housing industry in the 2010s.
Labor — Some details on each is useful for understanding the challenges of the 2010s. Residential construction faces a persistent labor shortage, which has resulted in higher costs and longer construction times. The effort to replace the 1.5 million workers lost during the Great Recession has been difficult. In fact, the skilled labor shortage has been cited as either the No. 1 or No. 2 business-related challenge for builders for the last five years of NAHB surveys.
As hiring has progressed and many organizations in the housing sector have enacted programs to recruit, train and sustain workers in the home building and remodeling sectors, the pace of those efforts has not kept up with demand. As of October 2019, there were more than 300,000 open positions in the construction sector. And for the last three years, the open jobs rate has been higher than the peak rate during the building boom of the last decade— a clear sign of the ongoing labor shortage in home building.
Land — Access to land and lots for building has also limited aggregate building volume since 2012. As of 2019, almost six out of ten home builders indicated that lot supplies were low or very low. Low lot supplies are due to a reduced number of land development companies, as well as tighter rules regarding zoning for housing and land development.
Lumber and materials — Lumber price volatility and access and cost of other building materials have also acted as a headwind for home construction. For example, in 2018 lumber prices expanded by 63% at their peak, adding thousands of dollars to the cost of a typical newly built home. While lumber prices were lower in 2019, other building material prices have increased.
Lending — Access to builder and developer financing is also a key ingredient for housing supply. Discussions of housing and lending are often exclusively focused on mortgage financing, but a buyer cannot buy a home before financing is ready for construction. Typically, small and regional builders rely on debt financing from banks. Such acquisition, development and construction (AD&C) lending has been tight in the 2010s. And loan data reveal the stock of such lending is off 61% since the start of 2008.
Laws and regulations — Finally, regulatory burdens have increased during the 2010s. NAHB analysis finds that 24% of the price of a typical newly-built single-family home is due to the broad set of regulatory burdens imposed by state, local and federal governments. Moreover, between 2011 and 2016, such costs increased by 29%, faster than inflation and economic growth. Such burdens are high for apartment construction as well, as a joint study by NAHB and National Multifamily Housing Council found that 32% of apartment costs are due to regulatory costs.
A Perfect Storm
The legacy of what Federal Reserve Chair Jerome Powell referred to as a “perfect storm” for home builders in terms of the supply-side headwinds and the impacts of the Great Recession itself have resulted in years of underbuilding, declines for vacancy rates, and increasing housing affordability burdens.
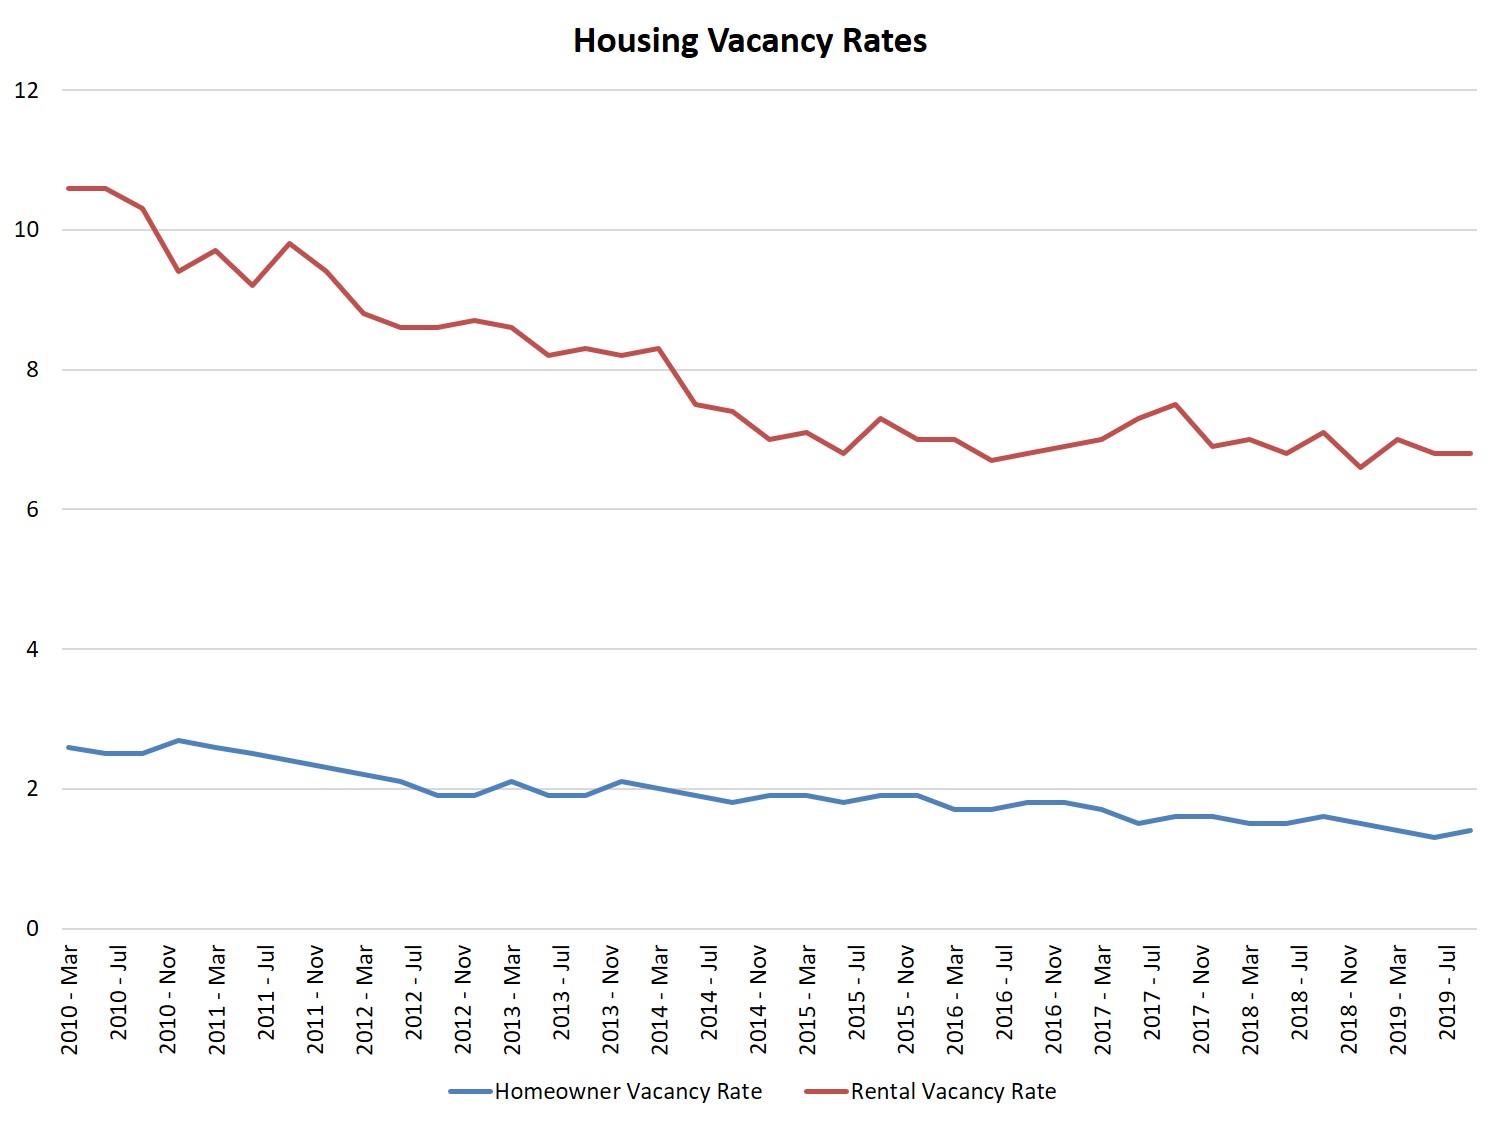
For example, the vacancy rate for for-sale housing at the start of 2010 was 2.6% per Census data, and ended the decade near 1.4%. The decline was even larger for rental properties, which started the decade with a 12.2% vacancy rate and ultimately declined to 6.8% by the end of 2019.
These declines point to the degree of underbuilding of housing for the U.S. in the 2010s. NAHB analysis found that the country is short one million total homes due to building conditions over the last decade. Other estimates are larger. For example, the midpoint of a Freddie Mac analysis suggests the U.S is short 2.5 million units.
Lack of supply has increased affordability challenges over the 2010s. According to the NAHB/Wells Fargo Housing Opportunity Index (HOI) approximately 79% of new and existing home sales were affordable for the typical family in 2012 (the start of the new HOI benchmarking). As of the third quarter 2019, that share had fallen to 64%. When interest rates were higher in late 2018, the HOI was near a decade low at 57%.
What’s Missing?
Much attention has been given to the missing middle, a useful if somewhat incomplete concept. While the market could certainly use more townhouses and low-rise apartments, the overall housing market is starved for the homes that became the hardest to build in the 2010s due to supply-side headwinds: entry-level, single-family detached homes.
In 2010, 59% of new single-family homes were smaller than 2,400 square feet, per Census data. By 2018, that share declined to 51%. The numbers are more stark at smaller sizes. In 2010, 32% of new homes were smaller than 1,800 square feet. That share fell to just 23% by 2018, the latest year for which there is data.
Identifying Solutions to Improve Affordability
Part of the process of the Long Recovery is rebuilding the industry’s infrastructure: its labor force and reliable sources of lending and building materials. Policy improvement is needed as well. For example, communities need to reduce the cost of construction by fighting impact fee increases and enabling building with density where the market demands it. Such actions will allow more construction of townhouses and smaller, single-family detached units. Condo multifamily construction remains too low, hampered by litigation concerns in some markets (a sixth “L,” perhaps?).
And then there are operational solutions that could add housing supply. Perhaps modular and panelized construction will advance to reduce the cost of building. However, the share of single-family homes built with these methods declined from 2017 to 2018 to just 3%. In 1998, the share of this construction was higher than current rates, at 7% of single-family starts.
Single-family built-for-rent (SFBFR) construction seems set for volume growth given the challenges of some households who want a single-family structure but cannot afford to buy a home. However, SFBFR housing represents just 5% of single-family starts at the end of 2019 compared to just under a 3% historical share.
And as inner suburb home construction lags, per the NAHB Home Building Geography Index, the attractiveness of tear-down construction will increase. Current data suggest such construction makes up 8% of single-family building, as new housing replaces older stock in desirable commuting locations.
Looking Ahead
It is clear that the home building industry will evolve in the 2020s, and it will do so to enable additional volume growth. While it is likely unrealistic to believe that the production totals of the 2000s will be achieved during the 2020s, there is little doubt that the 2020s will experience more single-family construction than the 2010s as Gen X reaches its peak earning years and Millennials increasingly seek out single-family homes for purchase.
Despite an increasing amount of attention given to Millennials, in the coming years NAHB estimates that about half of newly-built homes will be built for members of the generally overlooked Gen X (the latchkey kids become turnkey construction buyers). And Gen Z will enter apartment markets in greater numbers as this younger generation produces new households.
Nonetheless, with the end of the 2010s, the economic output of this industry is significant. And the corresponding policy issues are critical, as housing continues to gain more attention in presidential debates. From supporting and expanding the LIHTC, to improving access to affordable rental housing, as well as improving land use and zoning decisions to increase housing supply, and offering additional workforce development resources, housing issues are at the forefront of community development. And comprehensive housing finance reform, including the future of Fannie Mae and Freddie Mac, will occur during the 2020s.
With 6.8 million single-family homes built, 3.1 million apartments developed, and an estimated 150 million remodeling projects completed over the past decade, the home building industry currently supports 2.9 million direct workers plus many more in downstream sectors like suppliers, realtors, lenders and home retailers. More will join them in the 2020s – an emerging Dynamic Decade for home building.
(To get a sense of the scope of the industry as we enter the 2020s, be sure to join a local builder association and attend a meeting or register for the annual International Builders Show as part of Design and Construction Week.)
Discover more from Eye On Housing
Subscribe to get the latest posts sent to your email.

Outstanding in-depth article. As a question would come up, it was answered in the next paragraph.
Thanks
One of the best articles on housing I’ve read in a long time, excellent macro-analysis, passing it on.
Thanks Matt
This is a terrific read. Thanks for sharing. One question, how do you separate the custom home and single-family built-for-rent starts out from all of the starts? I’d love to see how this looks as a share of overall housing over the last 50-60 years.
Thanks Alex. We use quarterly Census data that only goes back to about the mid-1980s. You can find examples on this blog back in November.
Great article, but it did not take into account the 7% plus interest rate environment that we are now in…in late 2022. Housing shortages now appear to be a norm for several years to come as builders will surely pause on projects, or slow them down to a point of profitability. I cannot see a builder making the mistakes of 2005–2009…and ending up selling for peanuts. 2c.